MACD Indicator Strategy: How to Trade Momentum & Trend Confirmation Effectively
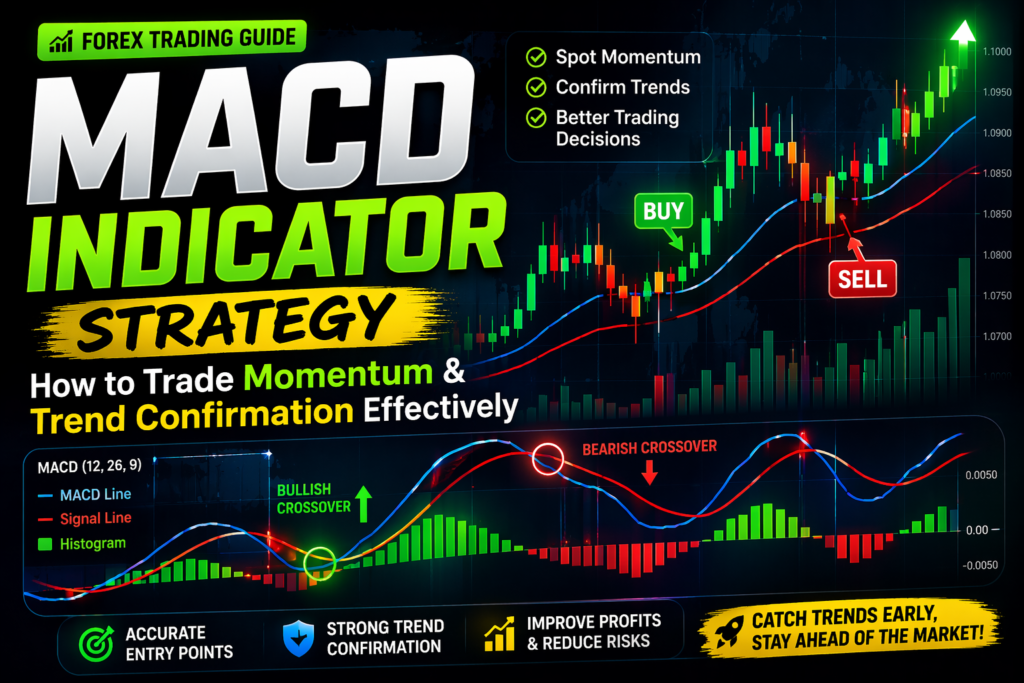
In forex trading, understanding both market momentum and trend direction is very important for consistent results. Many traders fail not because they cannot see the trend, but because they don’t confirm whether that trend is strong enough to continue. This is where the MACD indicator becomes extremely useful. The Moving Average Convergence Divergence (MACD) is a powerful and flexible indicator that helps traders analyze trend direction, measure momentum strength, and identify possible reversal points. It is popular among both beginners and experienced traders because it is easy to use and highly effective. Whether you are new to trading or already have experience, learning how to properly use MACD can improve your decision-making and help you trade with more confidence. What is MACD Indicator? MACD is a trend-following momentum indicator created by Gerald Appel. It is made up of three main elements: the MACD line, the signal line, and the histogram. The MACD line is formed by calculating the difference between a short-term moving average and a long-term moving average. The signal line is simply a smoothed average of the MACD line. The histogram shows the gap between these two lines. Because of this structure, traders can easily see both trend direction and momentum strength in one place. How MACD Works in Forex Trading MACD works by comparing two moving averages and tracking how they move relative to each other. When the short-term average starts moving further away from the long-term average, it shows that momentum is increasing. If the MACD line moves above the signal line, it usually signals bullish momentum. On the other hand, when it moves below the signal line, it indicates bearish momentum. The histogram helps traders understand how strong that momentum is. Larger bars mean stronger momentum, while smaller bars suggest that momentum is slowing down. Understanding MACD Components To use MACD properly, you must clearly understand each part of the indicator. The MACD line shows the overall momentum direction by measuring the difference between two averages. The signal line acts like a trigger, helping traders decide when to enter or exit trades. The histogram gives a visual representation of the distance between both lines, making it easier to spot changes in momentum quickly. MACD Crossover Strategy One of the simplest and most commonly used strategies is the crossover method. A buying opportunity appears when the MACD line crosses above the signal line, showing increasing bullish pressure. A selling opportunity appears when the MACD line crosses below the signal line, indicating growing bearish pressure. This method works best when the market is trending clearly, rather than moving sideways. MACD Zero Line Strategy The zero level is another important part of MACD. When the MACD line moves above zero, it shows that the market is gaining bullish strength. When it drops below zero, it suggests bearish control. Traders often use this level to confirm the overall trend direction. If MACD stays above zero, they focus more on buying opportunities. If it remains below zero, they prefer selling setups. MACD Divergence Strategy Divergence is a powerful signal that can warn about possible trend reversals. A bullish divergence happens when price creates lower lows, but MACD forms higher lows. This suggests that selling pressure is weakening. A bearish divergence happens when price makes higher highs, but MACD creates lower highs, indicating weakening buying strength. This concept helps traders catch reversals earlier than usual. MACD Histogram Strategy The histogram gives additional information about momentum changes. When the bars are growing taller, it shows that momentum is becoming stronger. When the bars begin to shrink, it signals that momentum is losing strength. Traders use this to decide whether to stay in a trade or exit before the market reverses. MACD Trend Confirmation Strategy MACD is also very useful for confirming trends. If both the MACD line and signal line are above zero, it confirms a strong upward trend. If both lines are below zero, it confirms a strong downward trend. This helps traders avoid taking trades against the main trend direction. Combining MACD with Other Indicators MACD becomes even more reliable when used with other tools. For example, combining it with RSI helps identify overbought and oversold conditions more accurately. Using moving averages can strengthen trend confirmation, while support and resistance levels can improve entry timing. This combination reduces false signals and increases overall accuracy. Common Mistakes When Using MACD Many traders misuse MACD and face losses. One common mistake is depending only on crossover signals without checking the overall trend. Another issue is entering trades too late, since MACD reacts after price movement. Ignoring risk management is also a big mistake that can lead to heavy losses. Avoiding these errors can improve trading performance. Best Timeframes for MACD Trading MACD can be used on different timeframes depending on your trading style. Scalpers prefer lower timeframes like 5-minute or 15-minute charts. Swing traders usually use 1-hour or 4-hour charts. Long-term traders rely on daily charts for bigger trends. Choosing the right timeframe is very important for success. Advantages of MACD Indicator MACD is simple and beginner-friendly. It provides clear signals for both trend and momentum. It works well across multiple markets and timeframes. Limitations of MACD Indicator MACD is a lagging indicator, meaning signals may appear after the move has already started. It may also give false signals during sideways or choppy markets. That’s why combining it with other tools is recommended. How Beginners Should Use MACD Beginners should start with basic strategies like crossovers and zero line confirmation. Practicing on demo accounts is very important before trading real money. Focus on consistency instead of quick profits, and always follow proper risk management. Trading Psychology and Discipline Success in trading is not just about strategy, but also about mindset. Emotions like fear and greed can lead to poor decisions. Traders should stick to their plan and avoid impulsive actions. Discipline is the key to long-term success. Compounding and Long-Term Growth Making small profits consistently is better than chasing big gains.
Stochastic Indicator Strategy: How to Catch Accurate Entry & Exit Points in Forex
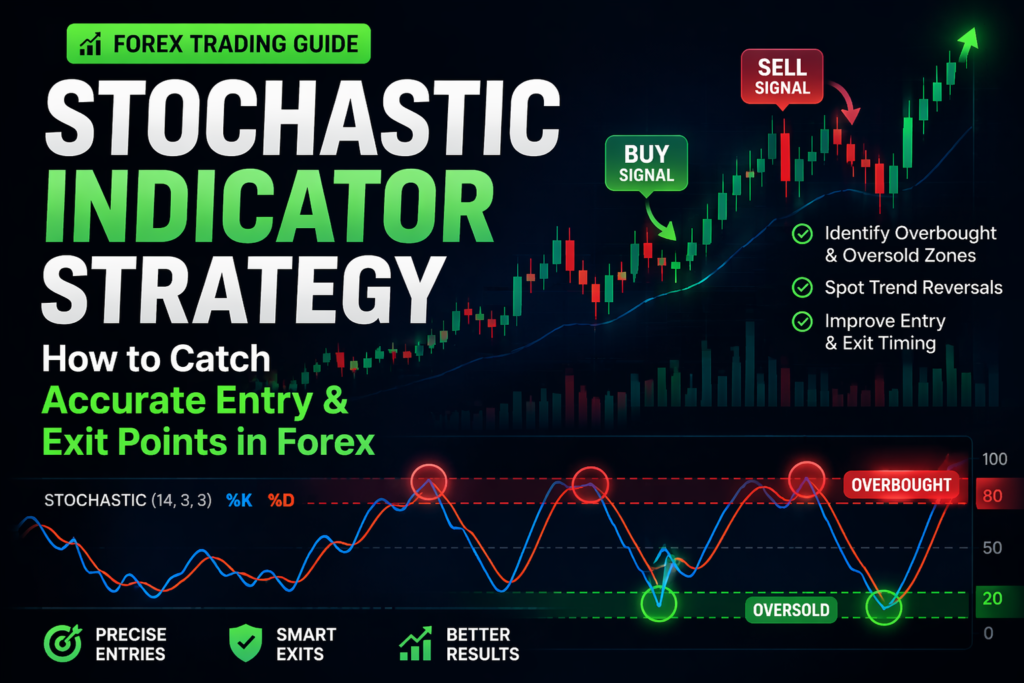
Forex trading is not just about identifying trends, but also about finding the right entry and exit points. Many traders struggle not because they don’t understand the market direction, but because they enter trades too early or too late. This is where momentum indicators like the Stochastic Indicator become extremely valuable. The Stochastic Indicator is one of the most effective tools for timing the market. It helps traders identify when the market is overbought or oversold and provides signals for potential reversals. Whether you are a beginner learning the basics or an experienced trader looking to improve timing accuracy, the Stochastic Indicator can significantly enhance your trading performance. What is the Stochastic Indicator? The Stochastic Indicator is a momentum oscillator that compares the closing price of an asset to its price range over a specific period. It was developed by George Lane and is widely used in forex trading to identify overbought and oversold conditions. The indicator moves between 0 and 100 and consists of two lines: %K and %D. The %K line represents the primary signal, while the %D line is a smoothed version derived from %K. When the Stochastic value is above 80, it indicates that the market may be overbought. When it is below 20, it suggests that the market may be oversold. How the Stochastic Indicator Works The Stochastic Indicator is based on the idea that in an uptrend, prices tend to close near the high of the range, and in a downtrend, they tend to close near the low. When the indicator moves upward, it shows increasing bullish momentum. When it moves downward, it reflects increasing bearish pressure. The interaction between the %K and %D lines creates trading signals. When %K crosses above %D, it indicates a potential buying opportunity. When %K crosses below %D, it suggests a selling opportunity. Understanding Overbought and Oversold Levels The most common use of the Stochastic Indicator is to identify overbought and oversold conditions. A buying opportunity is identified when the %K line moves above the %D line while the indicator is below 20. This means the price may have risen too quickly and could reverse or correct. When the indicator drops under 20, it signals that the market may be oversold and could be ready for a potential rebound. This indicates that the price may have dropped too much and could bounce back. However, just like any indicator, these levels should not be used alone. In strong trends, the market can remain overbought or oversold for extended periods. Stochastic Indicator Entry Strategy The Stochastic Indicator is widely used for precise entry timing. Traders look for crossovers between the %K and %D lines in key zones. A buy signal occurs when the %K line crosses above the %D line in the oversold zone (below 20). This suggests that bullish momentum is starting to build. A sell signal occurs when the %K line crosses below the %D line in the overbought zone (above 80). This indicates that bearish momentum may be increasing. This strategy is simple yet effective and is widely used by traders of all experience levels. Stochastic Indicator Exit Strategy The Stochastic Indicator is also useful for exit timing. Traders can use it to determine when to close a trade and secure profits. For example, if a trader enters a buy trade from the oversold zone, they may consider exiting when the indicator approaches the overbought zone. Similarly, for sell trades, exiting near the oversold zone can help lock in profits. This approach helps traders avoid staying in trades for too long and reduces the risk of reversals. Stochastic Divergence Strategy Divergence is one of the most powerful techniques in trading. It occurs when price and the indicator move in opposite directions. If the price is making higher highs but the Stochastic Indicator is making lower highs, it indicates weakening momentum and a potential reversal. If the price is making lower lows while the indicator is making higher lows, it suggests that bearish momentum is weakening and a bullish reversal may occur. Divergence helps traders identify early signals of trend changes. Stochastic with Trend Confirmation While the Stochastic Indicator is often used for reversals, it can also be used in trending markets. In an uptrend, traders look for buy signals when the indicator moves from oversold levels. In a downtrend, they look for sell signals from overbought levels. This approach ensures that traders align with the overall market trend instead of trading against it. Combining Stochastic with Other Indicators The Stochastic Indicator becomes more powerful when combined with other tools. For example, combining it with moving averages helps confirm the trend. Using it with RSI can provide stronger confirmation of overbought and oversold conditions. Support and resistance levels can further improve entry accuracy. This combination reduces false signals and increases trading confidence. Common Mistakes When Using Stochastic Indicator Many traders misuse the Stochastic Indicator. One common mistake is trading every crossover without considering market conditions. Another mistake is ignoring the trend. Taking buy signals in a strong downtrend or sell signals in a strong uptrend can lead to losses. Traders also rely too heavily on the indicator without using price action or risk management. Understanding these mistakes is essential for improving performance. Best Timeframes for Stochastic Trading The Stochastic Indicator can be used on different timeframes. Scalpers use lower timeframes like 5-minute or 15-minute charts. Swing traders prefer 1-hour or 4-hour charts, while long-term traders use daily charts. The key is to choose a timeframe that matches your trading style. Advantages of Stochastic Indicator The Stochastic Indicator is easy to use and provides clear signals. It helps traders identify entry and exit points with high accuracy. It works well in both ranging and trending markets when used correctly. Because of its simplicity and effectiveness, it is widely used by traders. Limitations of Stochastic Indicator Despite its advantages, the Stochastic Indicator has limitations. It can give false signals in strong trends. It also reacts quickly, which can lead
Moving Averages in Forex: Powerful Trend Following Strategies for Consistent Trading
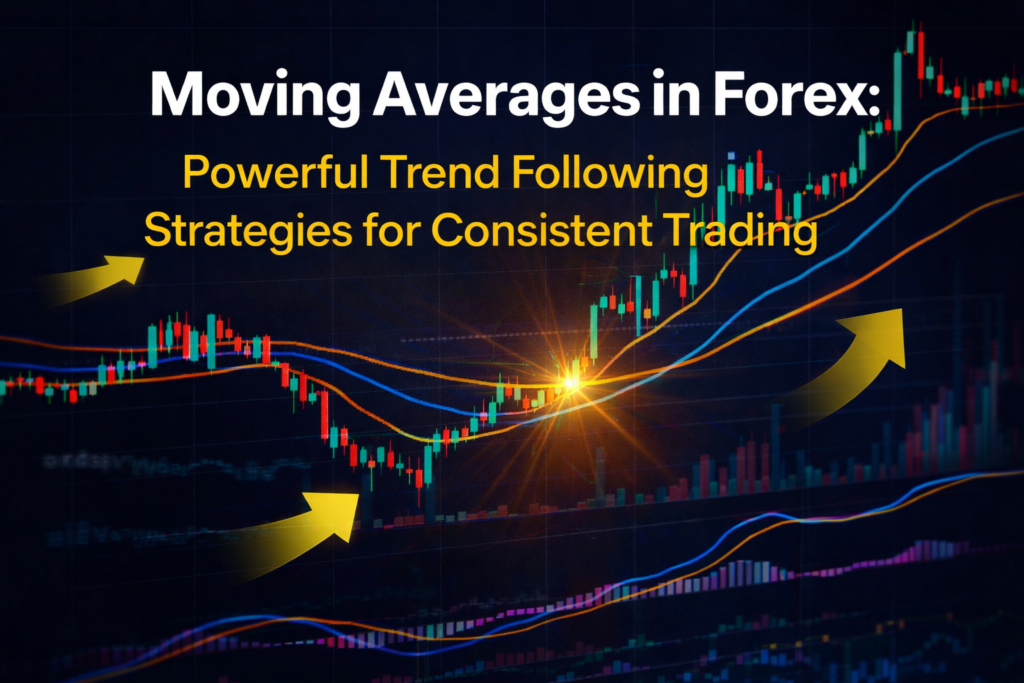
Forex trading mainly revolves around understanding market trends and making decisions based on price direction. One of the most effective and commonly used tools for identifying trends is the moving average. Traders around the world rely on moving averages to simplify price charts, reduce market noise, and find high-probability trading setups. Whether you are just starting your trading journey or already have experience in the market, moving averages can serve as a strong foundation for building a consistent trading approach. They help you clearly understand the direction of the market and avoid confusion caused by short-term fluctuations. What Are Moving Averages? Moving averages are technical indicators that calculate the average price of an asset over a selected period. Instead of focusing on every small price movement, they smooth out the data and present a clearer picture of the overall trend. There are multiple types of moving averages, but the two most commonly used are the Simple Moving Average (SMA) and the Exponential Moving Average (EMA). While both aim to identify trends, they differ in how they calculate price data. The primary purpose of moving averages is to filter unnecessary noise and highlight the true direction of the market. Types of Moving Averages in Forex There are two major types of moving averages widely used by traders: The Simple Moving Average (SMA) calculates the average price over a fixed number of periods, giving equal importance to all price points. Because of this, it reacts more slowly to recent price changes. The Exponential Moving Average (EMA), on the other hand, gives more weight to recent price data. This makes it more responsive and suitable for traders who want quicker signals. SMA is generally preferred for long-term analysis, while EMA is commonly used for short-term trading decisions. How Moving Averages Work in Forex Trading Moving averages appear as a line on the chart representing the average price over time. Their position relative to price helps traders understand market direction. When price stays above the moving average, it usually indicates a bullish trend. When price moves below it, it suggests a bearish trend. Additionally, the angle of the moving average is important. An upward slope shows strength in buying momentum, while a downward slope reflects selling pressure. This simple visual representation allows traders to quickly identify trends without overcomplicating their analysis. Why Moving Averages Are Important for Traders Moving averages help traders stay aligned with the market trend. Many beginners lose money because they try to trade against the trend without proper confirmation. By using moving averages, traders can filter weak signals and focus only on strong trading opportunities. They also act as dynamic support and resistance levels, which makes them even more valuable. Another advantage is their simplicity. They can be used across all markets and timeframes, making them suitable for every type of trader. Moving Average Trend Following Strategy One of the most powerful ways to use moving averages is through trend-following strategies. Instead of predicting reversals, traders follow the direction of the existing trend. If the price is trading above the moving average, traders look for buying opportunities. If the price is below it, they focus on selling setups. This approach works best when the market is trending clearly, allowing traders to capture consistent moves. EMA vs SMA: Which One Should You Use? Both EMA and SMA have their own benefits. EMA reacts faster to price changes, making it ideal for short-term trading. SMA provides a smoother line, which is useful for identifying long-term trends. There is no fixed rule about which one is better. Many traders combine both indicators to get a balanced understanding of the market. For example, EMA can be used for precise entries, while SMA helps confirm the overall trend direction. Moving Average Crossover Strategy The crossover strategy is one of the most popular methods used by traders. It involves using two moving averages with different time periods. A common setup includes a short-term moving average like 50 EMA and a long-term moving average like 200 EMA. When the shorter moving average crosses above the longer one, it signals a bullish trend. When it crosses below, it indicates a bearish trend. This method helps traders identify major trend shifts and enter trades at the right time. Golden Cross and Death Cross The Golden Cross and Death Cross are widely recognized signals in moving average trading. A Golden Cross happens when a short-term moving average crosses above a long-term moving average, indicating strong upward momentum. A Death Cross occurs when a short-term moving average crosses below a long-term moving average, signaling a potential downtrend. These patterns are often used by long-term traders to identify major market movements. Dynamic Support and Resistance Using Moving Averages Moving averages can also act as dynamic support and resistance levels. In an uptrend, price often pulls back to the moving average and then continues upward, treating it as support. In a downtrend, price may reject from the moving average and move lower, treating it as resistance. This behavior helps traders find better entry points and manage risk more effectively. Best Moving Average Settings for Forex The ideal moving average settings depend on your trading style. Short-term traders often use 9 EMA, 20 EMA, or 50 EMA. Swing traders prefer 50 EMA or 100 EMA. Long-term traders commonly use 100 SMA or 200 SMA. While there is no perfect setting, these levels are widely accepted and used by traders globally. Combining Moving Averages with Other Indicators Moving averages become more effective when used alongside other indicators. For example, combining them with RSI helps identify overbought and oversold conditions. MACD can confirm momentum, while support and resistance improve entry accuracy. Using multiple tools together reduces false signals and increases confidence in trades. Common Mistakes When Using Moving Averages Many traders misuse moving averages. One common mistake is relying on them without any confirmation. Another mistake is adding too many moving averages, which creates confusion instead of clarity. Traders also tend to enter trades late
Bollinger Bands Strategy: How to Trade Breakouts & Reversals Like a Pro
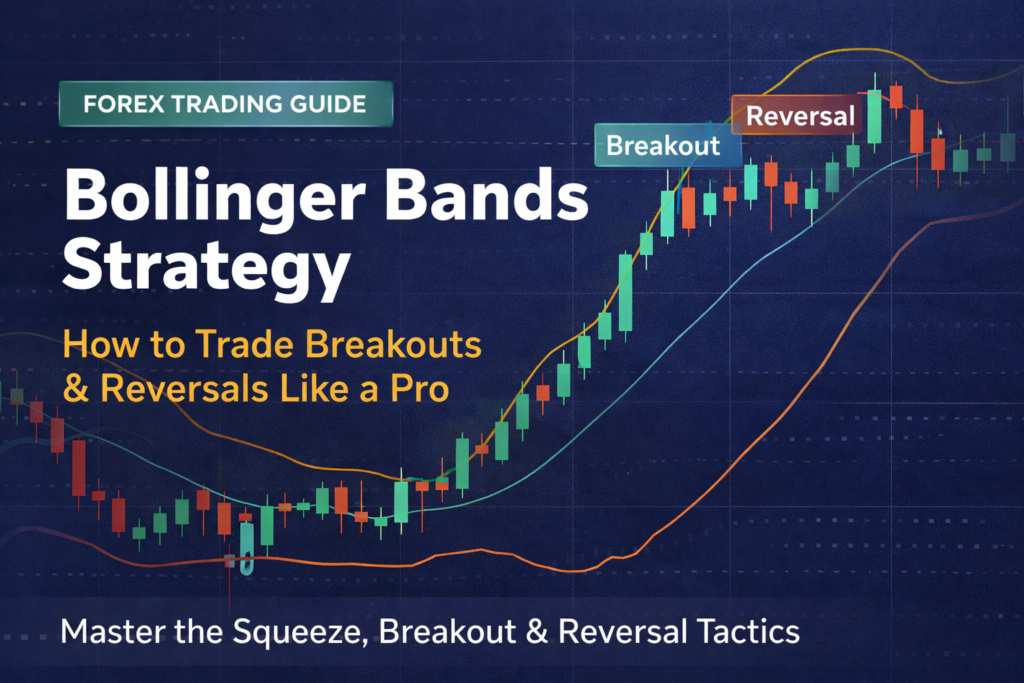
The forex market is constantly moving, and understanding volatility is one of the most important skills a trader can develop. Many traders focus only on direction, but experienced traders know that volatility plays a key role in identifying high-probability trading opportunities. One of the most powerful indicators used to measure volatility and market behavior is Bollinger Bands. Bollinger Bands is a widely used technical indicator that helps traders identify breakout opportunities, reversals, and market conditions such as expansion and contraction. Whether you are a beginner trying to understand the basics or an experienced trader looking to refine your strategy, Bollinger Bands can become a valuable part of your trading system. What Are Bollinger Bands? Bollinger Bands is a technical indicator developed by John Bollinger. It consists of three lines plotted on a price chart. The middle line is a moving average, usually a 20-period simple moving average, while the upper and lower bands are calculated based on standard deviation. The upper band represents a level above the moving average, and the lower band represents a level below it. These bands expand and contract based on market volatility. When volatility increases, the bands widen, and when volatility decreases, the bands contract. This dynamic behavior makes Bollinger Bands unique compared to other indicators. Instead of fixed levels, it adapts to market conditions, helping traders understand when the market is calm and when it is active. How Bollinger Bands Work To understand how Bollinger Bands work, it is important to focus on their structure. The middle band acts as a reference line, showing the average price over a certain period. The upper and lower bands act as dynamic support and resistance levels. When the price moves toward the upper band, it indicates strength and possible overextension. When the price moves toward the lower band, it suggests weakness or potential overselling. However, it is important to understand that touching the bands does not automatically mean the market will reverse. In strong trends, price can continue moving along the bands for a long time. Understanding Volatility with Bollinger Bands Volatility is one of the key concepts in trading, and Bollinger Bands is designed to measure it. When the bands are wide, it means the market is experiencing high volatility. Traders should experiment with different approaches and focus on the methods that consistently deliver better results. Low volatility periods are often followed by high volatility movements. This is why traders pay close attention to Bollinger Band contraction, also known as the squeeze. The squeeze indicates that the market is preparing for a breakout. When the bands start expanding after a squeeze, it often signals the beginning of a strong move. Bollinger Bands Breakout Strategy One of the most popular strategies using Bollinger Bands is the breakout strategy. This strategy focuses on identifying moments when the market moves from low volatility to high volatility. When the bands contract tightly, it signals that the market is in a consolidation phase. Traders wait for the price to break above the upper band or below the lower band. A breakout above the upper band indicates potential bullish momentum, while a breakout below the lower band suggests bearish momentum. However, traders should not rely solely on the breakout. Confirmation from volume, price action, or other indicators can improve accuracy. Bollinger Bands Reversal Strategy Another powerful use of Bollinger Bands is identifying reversals. When the price touches or moves outside the bands, it may indicate that the market is overextended. In such cases, traders look for signs of reversal. For example, if the price touches the upper band and shows rejection, it may move downward. Similarly, if the price touches the lower band and shows support, it may move upward. This strategy works best in range-bound markets where price moves between support and resistance levels. The Bollinger Band Squeeze Strategy The squeeze strategy is one of the most effective ways to trade Bollinger Bands. It focuses on identifying periods of low volatility before a major breakout. When the bands become very narrow, it indicates that the market is quiet. This is often followed by a sudden increase in volatility. Traders wait for the breakout direction and enter trades accordingly. The key to this strategy is patience, as traders must wait for the right setup. Using Bollinger Bands with Trend Trading Bollinger Bands can also be used in trending markets. In a strong uptrend, the price tends to stay near the upper band. In a downtrend, the price stays near the lower band. Traders can use this behavior to trade with the trend instead of against it. For example, in an uptrend, buying near the middle band can be a good opportunity. Understanding trend behavior helps traders avoid false signals and improves trade selection. Combining Bollinger Bands with Other Indicators While Bollinger Bands is powerful on its own, combining it with other indicators can improve results. For example, combining it with RSI can help identify overbought and oversold conditions more accurately. Using moving averages can help confirm trend direction, while MACD can provide momentum confirmation. This multi-indicator approach reduces false signals and increases confidence in trades. Common Mistakes When Using Bollinger Bands Many traders make mistakes when using Bollinger Bands. One common mistake is assuming that price touching the bands means immediate reversal. Another mistake is trading breakouts without confirmation. False breakouts are common, especially in low-volume markets. Traders also ignore market conditions, using the same strategy in both trending and ranging markets. Understanding these mistakes helps traders improve their performance. Best Timeframes for Bollinger Bands Bollinger Bands can be used on different timeframes depending on your trading style. Scalpers may use lower timeframes such as 5-minute or 15-minute charts. Swing traders often prefer 1-hour or 4-hour charts, while long-term traders use daily charts. As market volatility rises, the distance between the bands expands, while lower volatility causes the bands to tighten. Advantages of Bollinger Bands Bollinger Bands offers several advantages. It adapts to market volatility, making it dynamic and flexible. It
RSI Indicator Explained: Best Strategies to Identify Overbought & Oversold Markets
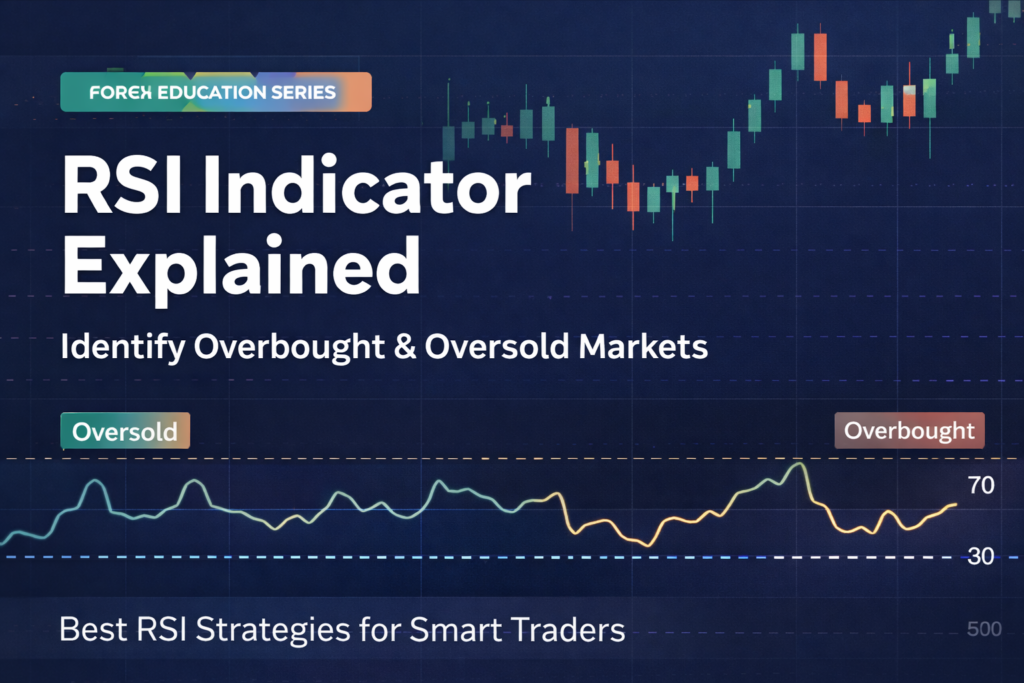
The forex market offers countless opportunities for traders, but success depends on understanding how price moves and how to identify the right entry and exit points. One of the most widely used technical indicators in trading is the Relative Strength Index, commonly known as RSI. This powerful momentum indicator helps traders understand whether a market is overbought or oversold, making it an essential tool for both beginners and experienced traders. In today’s fast-moving financial markets, traders rely on indicators that simplify decision-making and provide clear signals. The RSI indicator is one such tool that has stood the test of time due to its simplicity and effectiveness. Whether you are just starting your trading journey or already have experience in the market, understanding RSI can significantly improve your trading accuracy and confidence. What is RSI Indicator? The Relative Strength Index (RSI) is a technical indicator that evaluates how quickly price is moving and how strong those movements are over time. It was developed by J. Welles Wilder and is used to identify potential reversal points in the market. The RSI moves between 0 and 100, providing traders with insights into market strength and weakness. When the RSI value rises above a certain level, it indicates that the asset may be overbought. When it falls below a certain level, it suggests that the asset may be oversold. These signals help traders anticipate possible reversals or corrections in price. The RSI is not just about overbought and oversold conditions. It also helps traders understand market momentum, trend strength, and potential entry and exit points. Because of its versatility, RSI is widely used across forex, stocks, and cryptocurrency markets. How RSI Works in Forex Trading To truly understand how the RSI works, it is important to know how it reflects market behavior. The indicator calculates the average gains and losses over a specific period, usually 14 periods. Based on this calculation, it provides a value that shows whether buyers or sellers are dominating the market. When buyers are stronger, the RSI moves higher. When sellers take control, the RSI moves lower. This continuous movement helps traders visualize market sentiment in real time. For example, if the RSI is rising, it means bullish momentum is increasing. If it is falling, bearish momentum is strengthening. This makes RSI a powerful tool for identifying shifts in market direction. Understanding Overbought and Oversold Levels One of the most important concepts in RSI trading is understanding overbought and oversold conditions. These levels help traders determine when a market might be due for a reversal. In most cases, when RSI moves above the 70 level, it suggests that the market may be stretched on the upside. This means that the price has increased significantly and may be due for a correction or pullback. On the other hand, an RSI value below 30 is considered oversold, indicating that the price has dropped significantly and may bounce back. However, it is important to note that overbought does not always mean the price will immediately fall, and oversold does not guarantee an immediate rise. In strong trends, the RSI can remain in these zones for extended periods. Why RSI is Important for Traders The RSI indicator is important because it helps traders avoid emotional decisions and rely on data-driven analysis. Many beginners struggle with identifying the right time to enter or exit a trade. RSI simplifies this process by providing clear signals. It also helps traders confirm trends and identify potential reversals. By combining RSI with other tools, traders can improve their accuracy and reduce unnecessary risks. Another key advantage of RSI is its adaptability. It works well in different market conditions and can be used across various timeframes. Whether you are a scalper, day trader, or swing trader, RSI can fit into your strategy. RSI Strategy 1: Overbought and Oversold Reversal Strategy One of the most popular RSI strategies is the overbought and oversold reversal strategy. This approach focuses on identifying extreme market conditions and trading potential reversals. When the RSI moves above 70, traders look for selling opportunities, expecting the price to reverse downward. When the RSI falls below 30, traders look for buying opportunities, anticipating a potential upward movement. This strategy works best in range-bound markets where prices move between support and resistance levels. Traders often combine RSI with support and resistance to improve accuracy. RSI Strategy 2: RSI Divergence Strategy RSI divergence is a powerful technique used by experienced traders to identify potential trend reversals. Divergence happens when price action continues in one direction, but the RSI starts showing movement in the opposite direction, signaling weakening momentum. For example, if the price is making higher highs but the RSI is making lower highs, it indicates weakening momentum and a possible reversal. Similarly, if the price is making lower lows while RSI is making higher lows, it suggests that the downward momentum is weakening. This strategy helps traders spot early signs of trend changes before they become obvious in the price chart. RSI Strategy 3: RSI Trend Confirmation Strategy RSI can also be used to confirm trends. During an uptrend, RSI usually holds above the 40 level and frequently fluctuates within a higher range, often between 40 and 80. In a downtrend, it usually stays below 60 and moves between 20 and 60. Traders use this behavior to confirm whether a trend is strong or weakening. If RSI remains in the bullish zone, it confirms an uptrend. If it stays in the bearish zone, it confirms a downtrend. This strategy is especially useful for trend-following traders who want to trade in the direction of the market. RSI Strategy 4: RSI 50 Level Strategy The 50 level in RSI acts as a midpoint that indicates market direction. When RSI is above 50, it suggests bullish momentum. When it is below 50, it indicates bearish momentum. Traders use this level to confirm entries. For example, if RSI crosses above 50, it can be considered a buy signal. If it crosses below
Top Forex Trading Mistakes Beginners Must Avoid to Protect Their Capital
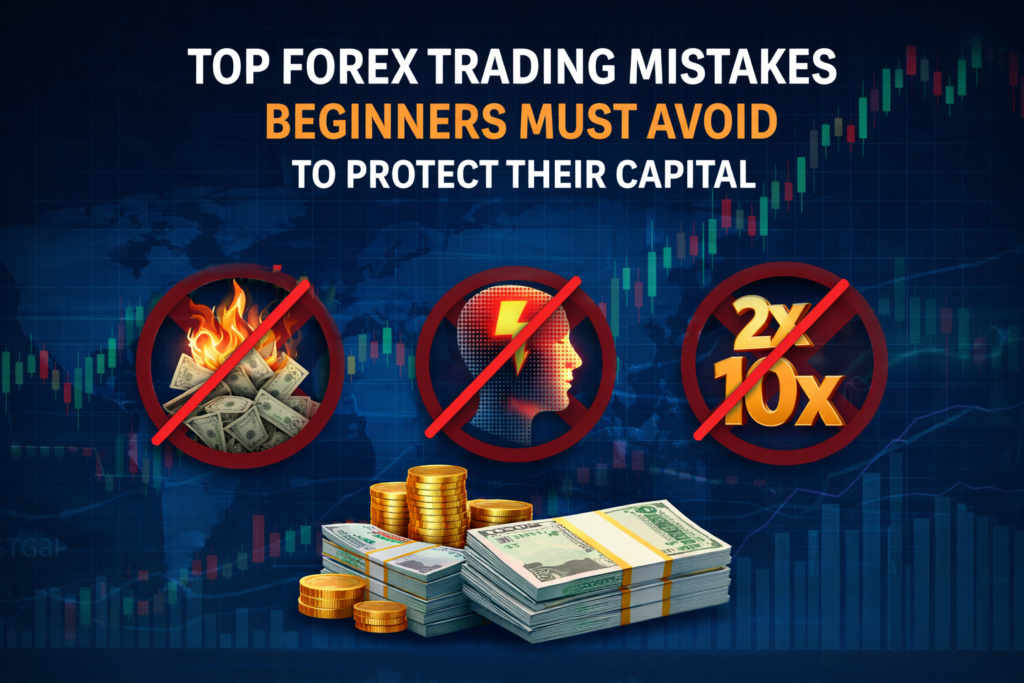
Forex trading has become increasingly popular among individuals who want to explore opportunities in global financial markets. With easy access to online platforms and growing awareness, many beginners enter the forex market every day with the goal of making profits. However, while the market offers opportunities, it also comes with significant risks, especially for those who lack proper knowledge and discipline. One of the biggest reasons why beginners fail in forex trading is not because the market is too complex, but because they make avoidable mistakes that lead to losses. When new traders enter the market, they often focus only on profit potential and ignore the importance of learning the basics. They are attracted by the idea of quick money and start trading without understanding how the market works. This lack of preparation creates a weak foundation, making it difficult to survive in the long run. Forex trading is not a shortcut to instant wealth; it is a skill that requires time, patience, and continuous improvement. One of the most common mistakes beginners make is trading without proper knowledge. Many traders start placing trades after watching a few videos or following random signals. They do not take the time to understand market structure, price movement, or trading strategies. Without a solid understanding, every trade becomes a gamble rather than a calculated decision. This is why learning the fundamentals is essential before risking real money. Another major mistake is ignoring risk management. Beginners often focus on how much they can earn rather than how much they can lose. They risk large portions of their capital on a single trade, hoping for big profits. However, the market does not always move as expected, and such behavior can lead to significant losses. Successful traders prioritize capital protection and use disciplined risk management techniques to stay consistent. At this point, it becomes important to understand forex trading mistakes beginners make as a pattern rather than isolated errors. These mistakes are repeated by many new traders because they follow the same mindset of chasing profits without proper planning. Recognizing these patterns early can help traders avoid unnecessary losses and build a more structured approach. Overtrading is another common issue. Many beginners believe that the more they trade, the more they will earn. This leads them to enter multiple trades without proper analysis. Overtrading increases exposure and emotional stress, often resulting in poor decision-making. Instead of focusing on quantity, traders should focus on quality and wait for high-probability setups. Managing emotions in trading is a major challenge, especially for new traders. Fear and greed can influence decisions and lead to mistakes. For example, after a loss, traders may try to recover quickly by taking impulsive trades. This often leads to further losses. Similarly, after a winning trade, traders may become overconfident and take unnecessary risks. Controlling emotions is essential for maintaining consistency. This often results in significant losses within a very short time. Many beginners avoid placing stop losses because they hope the market will reverse in their favor. However, this approach can result in large losses if the market continues moving against their position. A stop loss is a basic risk management tool that helps limit losses and protect capital. Ignoring it can be costly. Lack of a trading plan is also a major issue. Beginners often trade without a clear strategy or rules. They enter trades based on random signals or emotions rather than a structured approach. A trading plan provides guidelines for entry, exit, and risk management. Without it, traders are more likely to make inconsistent decisions. At a deeper level, traders need to understand common forex trading mistakes to avoid in order to improve their performance. These mistakes include poor risk management, emotional trading, overtrading, and lack of discipline. By identifying these issues, traders can take steps to correct them and develop better habits. Another common mistake is unrealistic expectations. Many beginners believe they can double their account quickly. This mindset leads them to take excessive risks. In reality, successful trading is about steady and consistent growth over time. Setting realistic goals helps traders stay focused and avoid unnecessary pressure. Ignoring market conditions is another problem. The forex market does not behave the same way all the time. Sometimes it trends strongly, while other times it moves sideways. Beginners often apply the same strategy in all conditions, which can lead to losses. Understanding market behavior and adapting strategies accordingly is essential. Many beginners also rely too much on indicators without understanding price action. While indicators can be useful, they should not be the only basis for trading decisions. Price action provides direct information about market behavior and is a more reliable tool for analysis. Combining indicators with price action can improve accuracy. Another mistake is not keeping a trading journal. A trading journal helps track performance and identify mistakes. By reviewing past trades, traders can learn what works and what does not. This process of self-analysis is crucial for improvement. At this stage, understanding how to avoid losses in forex trading becomes essential for long-term success. Avoiding losses does not mean winning every trade, but it means controlling risk and minimizing damage. Traders who focus on protecting their capital are more likely to survive and grow over time. Lack of patience is another major issue. Beginners often enter trades too early or exit too quickly. They do not wait for proper confirmation or follow their strategy. Patience allows traders to wait for the right opportunities and make better decisions. Another important factor is discipline. Many traders know what they should do but fail to follow their rules. Discipline is what separates successful traders from others. It ensures that traders stick to their plans and avoid impulsive actions. Using excessive leverage is also a common mistake. While leverage can increase profits, it also increases risk. Beginners often use high leverage without understanding its impact. Improper use of leverage can quickly result in heavy losses within a short time frame. Using leverage responsibly
How to Start Forex Trading Legally in India: Complete Beginner Guide

Forex trading has gained significant popularity in India over the past few years as more individuals explore online financial markets. With easy access to global trading platforms and growing awareness about currency trading, many people are interested in entering the forex market. However, one of the most important questions that arises is whether forex trading is legal in India and how to participate in it safely. Understanding the legal framework is essential before starting, as it helps traders avoid risks and operate within the boundaries of the law. In India, forex trading is not completely banned, but it is strictly regulated. The Reserve Bank of India (RBI) and the Securities and Exchange Board of India (SEBI) are the primary authorities that oversee financial markets and ensure compliance with regulations. These institutions set guidelines that traders must follow while participating in currency trading. The main objective of these regulations is to protect investors and maintain financial stability within the country. To understand the legal aspect clearly, it is important to know that forex trading is allowed in India only under specific conditions. Indian residents are permitted to trade currency pairs that are approved by regulatory authorities. These approved pairs generally involve the Indian Rupee being traded alongside globally recognized currencies. Trading in such pairs is considered legal when done through recognized exchanges in India. This ensures transparency and provides a secure environment for traders. At this stage, it becomes important to understand forex trading legal in India as a regulated activity rather than a completely open global market. Many beginners assume that they can trade any currency pair on any international platform without restrictions. However, this is not accurate. Indian regulations require traders to use authorized platforms and follow specific guidelines. Ignoring these rules can lead to legal complications and financial risks. In India, currency trading is primarily conducted through exchanges such as the National Stock Exchange (NSE), Bombay Stock Exchange (BSE), and Metropolitan Stock Exchange (MSE). These exchanges offer currency derivatives where traders can buy or sell currency contracts. These contracts are standardized and regulated, making them safer compared to unregulated platforms. Trading through these exchanges ensures that transactions are monitored and comply with legal standards. Another important aspect of legal forex trading in India is the use of authorized brokers. Traders must open accounts with brokers who are registered with SEBI. These brokers provide access to currency trading platforms and ensure that all transactions are conducted within regulatory guidelines. Choosing a reliable and regulated broker is essential for safety and compliance. One of the common mistakes beginners make is using offshore brokers that are not regulated in India. While these platforms may offer access to a wider range of currency pairs and higher leverage, they operate outside Indian jurisdiction. This means that traders may not have legal protection in case of disputes. It is always recommended to trade through authorized channels to ensure safety and compliance. Understanding the concept of currency pairs is also important when trading legally in India. The approved pairs generally include INR-based combinations such as USD/INR, EUR/INR, GBP/INR, and JPY/INR. These pairs are available on Indian exchanges and are regulated by authorities. Trading in these pairs allows individuals to participate in the forex market while staying within legal boundaries. At a deeper level, traders need to understand how to start forex trading in India legally by following a structured approach. The first step is to open a trading account with a registered broker. The next step is to complete the required documentation and verification process. Once the account is activated, traders can deposit funds and start trading on approved platforms. This process ensures that all activities are recorded and monitored. Education plays a crucial role in legal forex trading. Many beginners enter the market without understanding the rules and regulations, which can lead to mistakes. Learning about market structure, trading strategies, and risk management is essential before starting. Gaining this understanding allows traders to take better decisions and reduce avoidable mistakes. Risk management is another important factor. Even when trading legally, the forex market carries inherent risks due to price volatility. Traders must use proper risk control techniques such as setting stop losses, managing position sizes, and avoiding over-leverage. Such methods help safeguard trading capital and support consistent long-term growth. Another key aspect is taxation. Forex trading income in India is subject to taxation under applicable laws. Traders must maintain records of their transactions and report their earnings accurately. Understanding tax implications helps avoid legal issues and ensures compliance with financial regulations. Technology has made it easier for Indian traders to access currency markets. Modern trading platforms provide real-time charts, analytical tools, and fast execution. However, it is important to use platforms that are connected to regulated exchanges. This ensures transparency and reduces the risk of fraud. At this point, understanding rules for forex trading in India becomes essential for long-term success. These rules are designed to protect traders and maintain market integrity. Following these guidelines helps build trust and ensures a secure trading environment. Traders who operate within these rules are more likely to achieve consistent results. Another important factor is discipline. Many traders focus only on profits and ignore compliance. However, long-term success requires a balanced approach that includes both profitability and legality. Staying disciplined and following regulations is key to building a sustainable trading career. The role of leverage in India is also different compared to international markets. Indian regulations limit leverage to reduce risk exposure. While this may seem restrictive, it actually helps traders avoid large losses. Controlled leverage encourages responsible trading and promotes stability. Psychology also plays a role in trading success. Emotional decisions can lead to mistakes, especially when traders are influenced by quick profit expectations. Developing a disciplined mindset helps traders stay focused and follow their strategies effectively. Another advantage of trading through regulated exchanges is transparency. Prices are standardized, and all transactions are recorded. This reduces the chances of manipulation and ensures fair trading conditions. Traders
Understanding Support and Resistance in Forex Trading
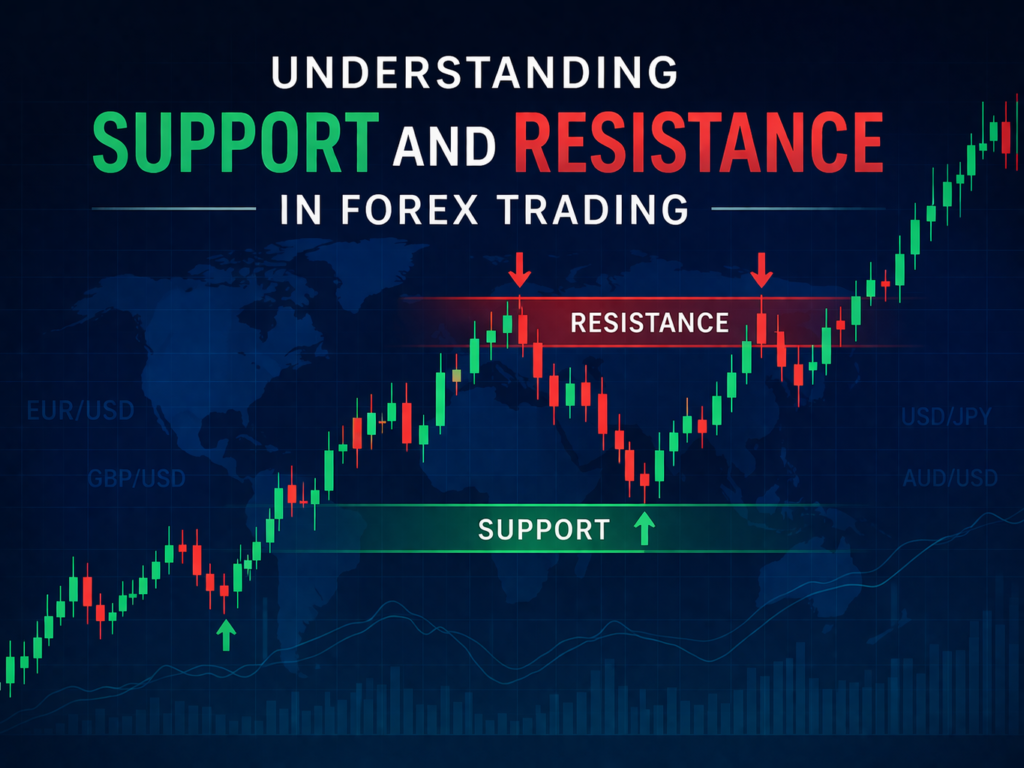
Forex trading is built on the idea of understanding price movement, and one of the most important concepts that every trader must learn is how price reacts at certain levels. These levels are not random; they are formed based on historical price behavior and market psychology. Traders across the world observe these areas closely because they often act as decision zones where the market either reverses or continues its trend. Learning how these levels work can significantly improve a trader’s ability to read charts and make informed trading decisions. In simple terms, support and resistance represent areas on a chart where price tends to react repeatedly. These levels are formed due to the interaction between buyers and sellers in the market. When buyers dominate, price moves upward, and when sellers dominate, price moves downward. Over time, certain price zones develop where buying or selling pressure becomes strong enough to influence market direction. These zones become reference points for traders and are used to identify potential entry and exit opportunities. Support is a price level where the market tends to stop falling and may start rising again. This happens because buyers enter the market at that level, creating demand. When price reaches support, traders often look for buying opportunities because there is a higher probability that the price may bounce upward. On the other hand, resistance is a level where price tends to stop rising and may start falling. This occurs because sellers step in, increasing supply. When price reaches resistance, traders look for selling opportunities. Understanding this behavior is essential because markets do not move in straight lines. Instead, they move in waves, constantly reacting to areas where demand and supply change. These reactions are influenced by human psychology, as traders tend to remember previous price levels and make decisions based on them. This creates a pattern where price repeatedly reacts at similar levels, making support and resistance highly reliable tools. At this stage, it becomes important to understand support and resistance forex trading as a core concept rather than just a basic idea. These levels are not exact lines but zones where price interaction occurs. Beginners often make the mistake of drawing precise lines, expecting the market to react perfectly at those points. In reality, price may slightly break above or below these levels before reversing. This is why experienced traders treat them as zones rather than fixed points. Another important factor is how these levels are formed. Strong support or resistance levels are usually created after multiple price rejections. The more times price reacts at a level, the stronger it becomes. This is because more traders recognize that level and place their orders around it. As a result, when price returns to that zone, the reaction becomes more significant. Market structure also plays a key role in understanding these levels. In an uptrend, support levels are more important because the market is moving upward, and traders look for buying opportunities at pullbacks. In a downtrend, resistance levels become more significant because traders look for selling opportunities when price retraces upward. Identifying the overall trend helps traders use support and resistance more effectively. Another concept that traders should understand is the role reversal of levels. Sometimes, a support level can turn into resistance, and a resistance level can turn into support. This happens when price breaks through a level and then returns to test it again. For example, if price breaks above a resistance level, that level may act as support when price comes back down. This behavior provides strong trading opportunities and is widely used by experienced traders. At a deeper level, traders begin to explore support resistance strategy in forex to refine their entries and exits. This involves combining these levels with other tools such as candlestick patterns, trend analysis, and price action. By doing so, traders can increase the probability of their trades and reduce risk. For example, waiting for confirmation signals at support or resistance levels can help avoid false entries. Another important aspect is understanding false breakouts. Sometimes, price may appear to break a level but quickly reverse direction. This can trap traders who enter trades too early. Experienced traders wait for confirmation before making decisions. They observe how price behaves around the level and look for signs of strength or weakness before entering a trade. Volume and market momentum also influence how price reacts at these levels. Strong momentum can cause price to break through support or resistance, while weak momentum may result in a reversal. Understanding these dynamics helps traders adapt their strategies based on market conditions. Psychology plays a major role in how support and resistance levels function. These levels exist because traders collectively believe in them. When many traders place buy or sell orders at the same level, it creates a strong reaction in the market. This collective behavior is what makes these levels effective and widely used. Another key factor is timeframes. Support and resistance zones appear across multiple timeframes, and their strength depends on the timeframe being used. Levels on higher timeframes such as daily or weekly charts are generally stronger than those on lower timeframes. Traders often use multiple timeframes to get a clearer picture of the market and improve their decision-making process. At this point, understanding how support and resistance works in forex becomes essential for building a structured trading approach. It is not just about identifying levels but also about understanding how price interacts with them. Traders who develop this skill can better anticipate market movements and improve their overall performance. Risk management is also closely connected to these levels. Traders often place stop losses beyond support or resistance zones to protect their capital. This ensures that if the market moves against their position, losses are limited. When traders combine strong risk control with precise level marking, their overall trading performance improves over time. Patience is another important quality when trading using support and resistance. Many traders rush into trades without waiting for proper
How Forex Market Works for Beginners: Complete Guide to Currency Trading (2026)
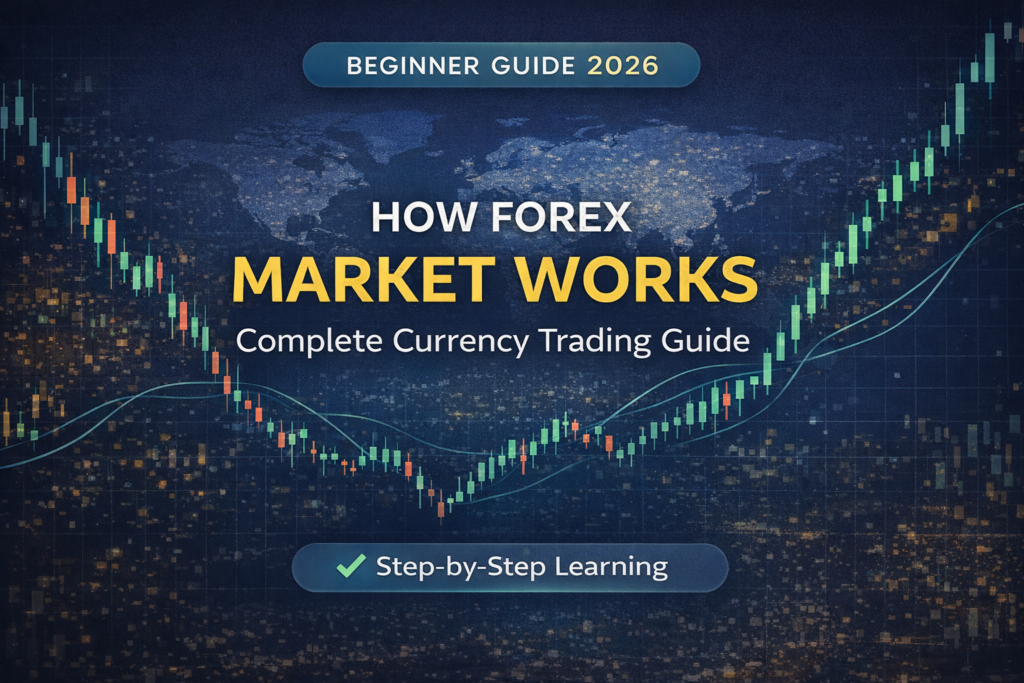
The global financial world offers countless opportunities for individuals who want to grow their wealth, and one of the most dynamic and widely traded markets today is the foreign exchange market. For anyone searching how forex market works, it is important to understand that this market is not just for banks or financial institutions, but also accessible to individual traders. Forex trading, often referred to as currency trading, involves the buying and selling of currencies with the objective of making profit from price movements. With increasing internet accessibility and trading platforms, more people are now exploring forex trading for beginners as a potential way to participate in global markets. To truly understand how forex market works, you need to start with its basic concept. The forex market is a decentralized marketplace where currencies are exchanged globally. Unlike stock markets, there is no single central exchange controlling forex trading. Instead, it operates through a network of banks, brokers, financial institutions, and individual traders. This decentralized nature is what makes forex unique and allows it to function continuously across different time zones. For beginners learning forex trading basics, this concept is essential because it explains why the market is always active and influenced by global events. Forex trading fundamentally revolves around pairs of currencies, where one currency is exchanged against another in every transaction. This means whenever a trader enters a position, they are simultaneously purchasing one currency while selling another. For instance, in the EUR/USD pair, the trader is evaluating how the euro performs in comparison to the US dollar. If they expect the euro to gain strength, they take a buy position, and if they anticipate weakness, they choose to sell. This dual structure forms the basic framework of currency trading and is one of the first concepts beginners need to understand clearly. In financial markets, liquidity describes how quickly a trader can buy or sell an asset without causing a noticeable change in its price. The forex market is known for its extremely high liquidity, which allows traders to execute trades smoothly and exit positions without delays. Because of this, both short-term and long-term traders find forex attractive, as orders are filled efficiently even during active market conditions. One of the most appealing features of forex trading is its flexibility. The market operates twenty-four hours a day during weekdays, allowing traders to participate at any time. This continuous operation is possible because trading activity moves across major financial centers such as London, New York, Tokyo, and Sydney. As one session ends, another begins, ensuring that the market remains active. For beginners trying to understand how forex market works, this global cycle provides the opportunity to trade based on personal schedules. Currency prices in the forex market are constantly changing due to various economic and geopolitical factors. These include interest rates, inflation, employment data, political stability, and global economic conditions. For example, if a country raises its interest rates, it may attract foreign investors, increasing demand for its currency and causing its value to rise. Similarly, political instability can weaken a currency. Understanding these factors is an important part of forex trading basics and helps traders analyze market trends effectively. Leverage is a feature that enables traders to open positions that are larger than the amount of money available in their trading account. In simple terms, it provides additional market exposure without requiring full capital upfront. While this can increase the potential for higher returns, it also increases the level of risk involved. For this reason, beginners should use leverage cautiously and always combine it with proper risk control to avoid large losses. Managing risk effectively is a key factor in long-term trading success. Experienced traders typically risk only a small portion of their total capital on a single trade, which helps them handle losing streaks without damaging their account significantly. Without this approach, even a few unsuccessful trades can lead to major losses. For beginners especially, focusing on protecting capital is more important than chasing high profits. There are different trading styles in forex, and each trader chooses a strategy based on their personality and goals. Scalping involves making quick trades within minutes, aiming for small profits. Day trading refers to a style where traders complete both entry and exit of positions within a single trading session, avoiding overnight exposure. Swing trading focuses on capturing price movements over several days. Long-term trading involves holding positions for weeks or months based on economic trends. Each strategy requires a different level of patience, analysis, and risk tolerance. Learning these styles is an essential part of forex trading basics. Technology has played a major role in making forex trading accessible. Today, traders can use advanced trading platforms that provide real-time charts, indicators, and analytical tools. These platforms allow traders to analyze price movements and execute trades instantly. Mobile trading has made it even easier, allowing traders to participate in the market from anywhere. This accessibility is one of the reasons why searches for learn forex trading and currency trading guide have increased rapidly. Despite its advantages, forex trading is not easy. Many beginners enter the market expecting quick profits but end up facing losses due to lack of knowledge and emotional decisions. Trading requires discipline, patience, and continuous learning. Successful traders spend time studying the market, testing strategies, and improving their skills. Understanding how forex market works is just the beginning; mastering it takes time and experience. A well-defined trading plan is essential for success. This plan should include entry and exit rules, risk management strategies, and profit targets. By following a structured approach, traders can reduce emotional decisions and maintain consistency. Reviewing past trades and learning from mistakes is also important for improvement. This disciplined approach is what separates successful traders from unsuccessful ones. The mental aspect of trading has a strong influence on overall performance. Emotional reactions such as panic, overconfidence, or impatience can lead to poor judgment. For example, traders may close positions too early out of fear
Demystifying Foreign Exchange: A Beginner’s Guide to Understanding the Forex Market

The foreign exchange market, often called the forex market, is one of the most active financial markets in the world. Every day, enormous amounts of currency are exchanged globally for trade, investment, and financial transactions. Despite its size and importance, many people still find the concept of foreign exchange confusing. This is why demystifying foreign exchange is important for anyone interested in trading, investing, or understanding the global economy. Foreign exchange trading may sound complex at first, but once the basic concepts are understood, the structure of the market becomes much clearer. This article aims to simplify the forex market, explain how it works, and help beginners understand the essential components of currency trading. Understanding Foreign Exchange Foreign exchange describes the global activity where one country’s currency is exchanged for another currency in international financial transactions. This exchange happens for many reasons. Businesses convert currency to pay international suppliers, travelers exchange money when visiting other countries, and investors trade currencies to profit from changes in exchange rates. The foreign exchange market operates through a global network of banks, financial institutions, companies, and individual traders. Unlike traditional stock markets, the forex market does not operate from a single central exchange. Instead, it functions electronically across different financial centers worldwide. Because the forex market is decentralized, trading occurs continuously across different time zones, allowing participants to buy and sell currencies almost around the clock during weekdays. Why Demystifying Foreign Exchange Matters For beginners, the forex market can appear overwhelming because of the terminology and the fast movement of currency prices. However, understanding the basics removes much of the confusion. When people start demystifying foreign exchange, they begin to realize that currency trading follows logical economic principles. Exchange rates move based on supply and demand, economic conditions, and financial expectations. By understanding how currencies interact with each other, traders can analyze market movements and make more informed decisions. How the Forex Market Works Within the global currency market, every trade involves two currencies where the value of one currency is measured against another. This means one currency is exchanged for another. For example, a currency pair might represent the value of one currency relative to another. When traders buy a currency pair, they expect the first currency to strengthen compared to the second. If they sell the pair, they expect the opposite. Currency prices constantly change due to global economic activity, making it possible for traders to profit from price movements. These fluctuations occur because of factors such as economic growth, interest rate changes, political stability, and international trade. Major Participants in the Forex Market The forex market involves many different types of participants, each contributing to the overall liquidity and activity of the market. One of the most influential participants is central banks, which manage national monetary policies and may intervene in currency markets to stabilize their economies. Commercial banks also play a large role in currency trading, handling transactions for corporations and governments. Large international companies participate in forex trading because they need to exchange currencies when conducting global business operations. Investment funds and financial institutions trade currencies to manage portfolios and diversify investments. Finally, individual traders participate through online trading platforms, analyzing market trends and attempting to profit from price movements. The Role of Currency Pairs Currency pairs are the foundation of forex trading. Every trade involves two currencies, where the value of one currency is measured against another. Some currency pairs are traded more frequently than others because they involve economies with large global influence. These widely traded pairs often have high liquidity and tight spreads. Understanding how currency pairs behave helps traders identify potential opportunities and evaluate market conditions. Factors That Influence Currency Prices Currency values are affected by numerous global factors. One of the most important influences is economic performance. Countries with strong economies often have stronger currencies. Interest rates also play a major role in currency movements. Higher interest rates can attract international investors, increasing demand for that country’s currency. Political stability is another factor. Investors generally prefer currencies from countries with stable governments and predictable policies. Trade balances, inflation levels, and employment statistics can also affect currency demand and exchange rates. These factors combine to create constant fluctuations in the forex market. The Global Nature of Forex Trading One of the unique aspects of the forex market is its global nature. Trading activity shifts between major financial centers located in different regions of the world. As one region’s trading session closes, another begins. This rotation of trading sessions allows the market to remain active for most of the week. Because traders from different countries participate simultaneously, the forex market reflects global economic sentiment. Advantages of the Forex Market There are several reasons why many traders are attracted to forex trading. One advantage is liquidity. The forex market handles a large volume of transactions, making it easier to enter and exit trades quickly. Another advantage is accessibility. With modern trading platforms, individuals can participate in currency trading from almost anywhere with an internet connection. Forex trading also allows traders to profit from both rising and falling markets, since positions can be opened in either direction. These features make forex appealing to both beginners and experienced traders. Challenges in Forex Trading While the forex market offers opportunities, it also involves risks. Currency prices can move rapidly, especially during major economic announcements or unexpected global events. Beginners sometimes underestimate the importance of risk management and may experience losses if they trade without proper planning. Successful traders understand that consistent results require discipline, patience, and continuous learning. Understanding market behavior and developing a trading strategy are important steps toward long-term success. The Importance of Education in Forex Trading Education plays a critical role in helping traders understand the complexities of the forex market. Learning about technical analysis, fundamental analysis, and risk management helps traders build a strong foundation. Many traders spend time studying charts, economic reports, and market trends before making trading decisions. Developing trading skills takes time, and