What is a Breaker Block in Forex Trading? A Complete Guide with Examples
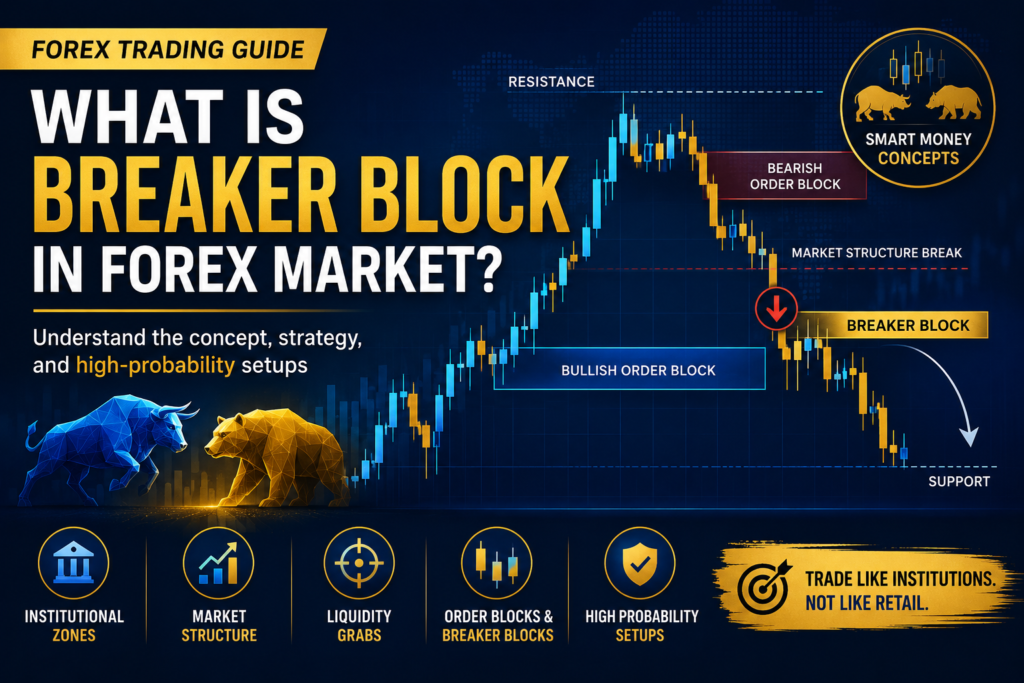
Introduction The Forex market is full of institutional trading concepts that help traders understand how smart money operates. Among these concepts, the Breaker Block is one of the most powerful tools used by traders following Smart Money Concepts (SMC) and ICT (Inner Circle Trader) methodologies. A Breaker Block is essentially a failed Order Block that transforms into a new support or resistance zone after market structure changes. It represents an area where institutional traders may have trapped retail traders before reversing the market direction. Many traders struggle because they enter trades too early or fail to identify where major market reversals may occur. Understanding Breaker Blocks can help traders identify high-probability entries, improve risk-to-reward ratios, and trade alongside institutional market participants. In this article, we will explore the concept of Breaker Blocks in detail, understand their formation, analyze examples, and learn how to use them effectively in Forex trading. Understanding Market Structure Before learning Breaker Blocks, traders must understand market structure. The market generally moves in three ways: In an uptrend, the market creates: In a downtrend, the market creates: A change in market structure occurs when these patterns are broken. For example: If the market is creating Higher Highs and Higher Lows but suddenly breaks below a previous Higher Low, it signals potential bearish market structure. This structural shift is the foundation of Breaker Block formation. What Exactly is a Breaker Block? A Breaker Block is a former Order Block that fails and later becomes a support or resistance zone. In simple words: Similarly: The logic behind this concept is based on trapped traders. When traders place positions based on an Order Block and the market moves against them, their stop losses and liquidation create additional momentum in the opposite direction. Institutions often use these liquidity events to fuel larger market moves. Image Prompt: Basic Breaker Block Concept Design a forex chart showing a bullish order block failing and transforming into a bearish breaker block. Highlight trapped buyers, stop-loss hunts, and reversal zones. Difference Between Order Block and Breaker Block Many traders confuse Order Blocks and Breaker Blocks. An Order Block is: A Breaker Block is: For example: Bullish Order Block: Price returns to the zone and bounces upward. Bullish Breaker Block: Price breaks below the zone, returns to retest it, and then continues downward. This distinction is extremely important because it changes the trader’s directional bias. Image Prompt: Order Block vs Breaker Block Split-screen forex chart comparing a successful order block and a failed order block turning into a breaker block. Educational infographic style. How a Bearish Breaker Block Forms A bearish Breaker Block develops through a sequence of events. Step 1: The market is bullish. Step 2: A bullish Order Block forms. Step 3: Price moves higher and attracts buyers. Step 4: Price suddenly breaks below the bullish Order Block. Step 5: Market structure shifts bearish. Step 6: Price retraces back to the failed Order Block. Step 7: The failed Order Block acts as resistance. Step 8: Price continues downward. This failed bullish Order Block now becomes a bearish Breaker Block. Image Prompt: Bearish Breaker Block Formation Create a detailed forex chart illustrating bullish trend, bullish order block, market structure break, retracement, and bearish continuation from the breaker block. Example of a Bearish Breaker Block Suppose EUR/USD is trading at 1.1500. Price forms a bullish Order Block near 1.1450 and rallies to 1.1600. Most traders believe the market will continue upward. However: The market suddenly falls below 1.1450. This break invalidates the bullish Order Block. Price later revisits 1.1450. Instead of bouncing upward, sellers enter aggressively. The market drops to 1.1300. The zone around 1.1450 becomes a bearish Breaker Block. This setup provides an excellent selling opportunity. Image Prompt: EURUSD Bearish Breaker Example Professional EUR/USD forex chart showing bearish breaker block setup with entry, stop loss, target, and risk-reward ratio. How a Bullish Breaker Block Forms A bullish Breaker Block is the opposite. Step 1: The market is bearish. Step 2: A bearish Order Block forms. Step 3: Price attracts sellers. Step 4: Price unexpectedly breaks above the bearish Order Block. Step 5: Bullish market structure emerges. Step 6: Price retraces back to the failed bearish Order Block. Step 7: The zone acts as support. Step 8: Price rallies higher. The failed bearish Order Block becomes a bullish Breaker Block. Image Prompt: Bullish Breaker Block Formation Create a forex trading chart showing bearish order block failure, market structure shift, retracement, and bullish continuation from a breaker block. Example of a Bullish Breaker Block Assume GBP/USD is trading at 1.2800. A bearish Order Block forms at 1.2850. Price initially moves downward. Suddenly, institutional buying enters the market. Price breaks above 1.2850. This invalidates the bearish Order Block. Later, the market retraces to 1.2850. Buyers enter aggressively. The market rallies toward 1.3100. The former bearish Order Block becomes a bullish Breaker Block. Image Prompt: GBPUSD Bullish Breaker Example Detailed GBP/USD chart showing bullish breaker block entry, stop-loss placement, take-profit targets, and institutional buying. Why Breaker Blocks Work Breaker Blocks work because they exploit trader psychology. Most retail traders: When these zones fail: Institutional traders often target these liquidity pools. The trapped traders unintentionally provide fuel for the new trend. This is why Breaker Blocks frequently become powerful reversal zones. Image Prompt: Liquidity and Trapped Traders Educational forex illustration showing trapped traders, stop-loss clusters, liquidity pools, smart money, and breaker block reversals. Using Breaker Blocks with Liquidity The best Breaker Blocks usually form near liquidity. Liquidity may exist above: Liquidity may exist below: Institutions often sweep liquidity first before activating the Breaker Block. This increases the probability of successful trades. Professional traders always look for liquidity grabs before entering Breaker Block setups. Image Prompt: Breaker Block and Liquidity Sweep Forex chart illustrating equal highs, liquidity sweep, breaker block retest, and market reversal. Breaker Blocks and Fair Value Gaps A powerful trading strategy combines: A Fair Value Gap represents market imbalance. When a Breaker Block overlaps with a Fair Value
Monetary Policy Cycle Trading Strategy: Trade Forex Using Central Bank Decision Phases
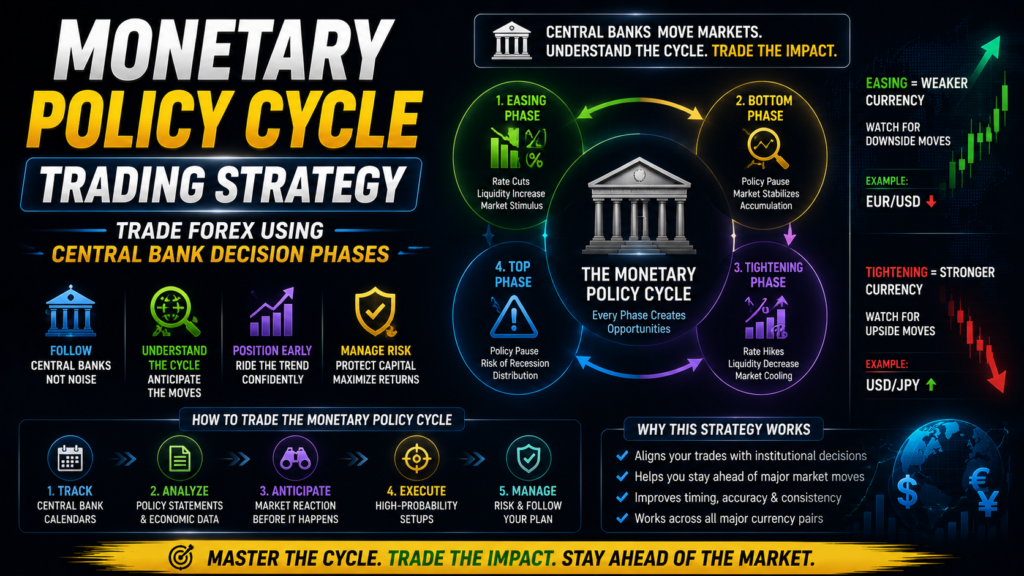
Modern forex trading is no longer driven only by chart patterns and technical indicators. In 2026, institutional traders increasingly focus on macroeconomic cycles and central bank behavior to predict long-term currency direction. One of the most powerful approaches in macro trading is understanding monetary policy cycles. Central banks influence global capital flows through interest rates, liquidity conditions, inflation control, and economic guidance. Traders who understand these cycles gain a significant advantage because currencies often move months before economic headlines become obvious. This is why monetary policy cycle trading strategy, central bank forex analysis, and interest rate cycle trading have become some of the most valuable concepts in professional trading. Most beginner traders only react to news after major market moves have already happened. Institutional traders operate differently. They analyze central bank phases to anticipate market direction before the majority of traders recognize the shift. By understanding easing cycles, tightening cycles, and policy pivots, traders can align themselves with larger market flows. Mastering monetary policy cycle trading strategy, central bank forex analysis, and interest rate cycle trading allows traders to build stronger macro conviction and improve long-term execution. Understanding Monetary Policy Monetary policy refers to the actions central banks take to influence economic conditions. Their primary goals usually include controlling inflation, supporting employment, maintaining financial stability, and encouraging sustainable growth. Central banks achieve these objectives mainly through interest rate decisions, liquidity management, and communication with financial markets. Understanding these actions forms the foundation of monetary policy cycle trading strategy, central bank forex analysis, and interest rate cycle trading. Why Monetary Policy Matters in Forex Currencies are highly sensitive to changes in monetary policy because capital moves toward stronger returns. When a country offers higher interest rates, investors may shift capital into that currency to seek better yields. When rates fall, capital may leave. As a result, currencies frequently trend according to policy expectations rather than current economic conditions. Understanding this relationship strengthens monetary policy cycle trading strategy, central bank forex analysis, and interest rate cycle trading. What is a Monetary Policy Cycle A monetary policy cycle refers to the changing stages of central bank decisions over time. Markets usually move through periods of tightening, stability, easing, and policy transition. Each phase creates different trading opportunities. Recognizing these phases is central to monetary policy cycle trading strategy, central bank forex analysis, and interest rate cycle trading. The Tightening Phase Explained A tightening phase occurs when central banks increase interest rates or reduce liquidity. This usually happens when inflation rises above target levels or economic activity becomes too strong. Higher rates often strengthen the currency because investors seek improved returns. Understanding tightening cycles improves monetary policy cycle trading strategy, central bank forex analysis, and interest rate cycle trading. The Easing Phase Explained An easing cycle occurs when central banks lower interest rates or inject liquidity into markets. This is often done to support growth during economic slowdowns. Lower rates generally reduce currency attractiveness and may weaken exchange rates. Recognizing easing conditions strengthens monetary policy cycle trading strategy, central bank forex analysis, and interest rate cycle trading. Understanding Policy Pivot Points Policy pivots are among the most powerful moments in macro trading. A pivot happens when a central bank shifts direction after maintaining a previous stance for an extended period. For example, moving from aggressive tightening toward neutral policy can dramatically change currency trends. Understanding pivots improves monetary policy cycle trading strategy, central bank forex analysis, and interest rate cycle trading. The Role of Interest Rates Interest rates directly influence investment decisions. Higher interest rates increase capital inflows and often support currency appreciation. Lower interest rates may encourage capital outflows and weaken currency demand. Interest rates remain one of the strongest drivers of monetary policy cycle trading strategy, central bank forex analysis, and interest rate cycle trading. Federal Reserve and Currency Markets The Federal Reserve plays a major role because the US dollar influences global financial markets. Changes in Federal Reserve expectations affect forex pairs, commodities, and global risk sentiment. Dollar movements frequently begin before official decisions are announced. Understanding Federal Reserve behavior supports monetary policy cycle trading strategy, central bank forex analysis, and interest rate cycle trading. European Central Bank Influence The European Central Bank strongly impacts EUR-based currency pairs. Policy changes influence lending conditions, growth expectations, and capital movement across Europe. ECB communication often drives major EUR/USD movements. This strengthens monetary policy cycle trading strategy, central bank forex analysis, and interest rate cycle trading. Bank of England Market Impact The Bank of England heavily influences GBP pairs. Changes in inflation outlook and growth expectations often create strong directional moves. Institutional traders monitor these developments closely. Understanding BOE decisions improves monetary policy cycle trading strategy, central bank forex analysis, and interest rate cycle trading. Bank of Japan and Global Capital Flow Japan operates differently because of its long history of lower rates and unique yield policies. BOJ shifts can influence global carry trades and USD/JPY movement. Understanding these dynamics supports monetary policy cycle trading strategy, central bank forex analysis, and interest rate cycle trading. Inflation and Policy Cycles Inflation is one of the most important variables central banks monitor. Persistent inflation often increases the probability of tighter policy. Weak inflation may encourage easing. Understanding inflation expectations strengthens monetary policy cycle trading strategy, central bank forex analysis, and interest rate cycle trading. Economic Growth and Currency Strength Growth data influences policy decisions. Strong economic performance may support tighter conditions and stronger currencies. Weak growth often leads to supportive measures. This relationship improves monetary policy cycle trading strategy, central bank forex analysis, and interest rate cycle trading. Market Expectations vs Reality Markets often react more to expectations than actual decisions. If traders already expect a rate increase, the currency may not strengthen after the announcement. Unexpected policy shifts create the largest moves. Understanding expectations supports monetary policy cycle trading strategy, central bank forex analysis, and interest rate cycle trading. How Institutions Position Before Decisions Institutions rarely wait for official announcements. They gradually build positions
Intermarket Correlation Trading Strategy: Use Dollar, Gold & Bonds to Predict Forex Moves
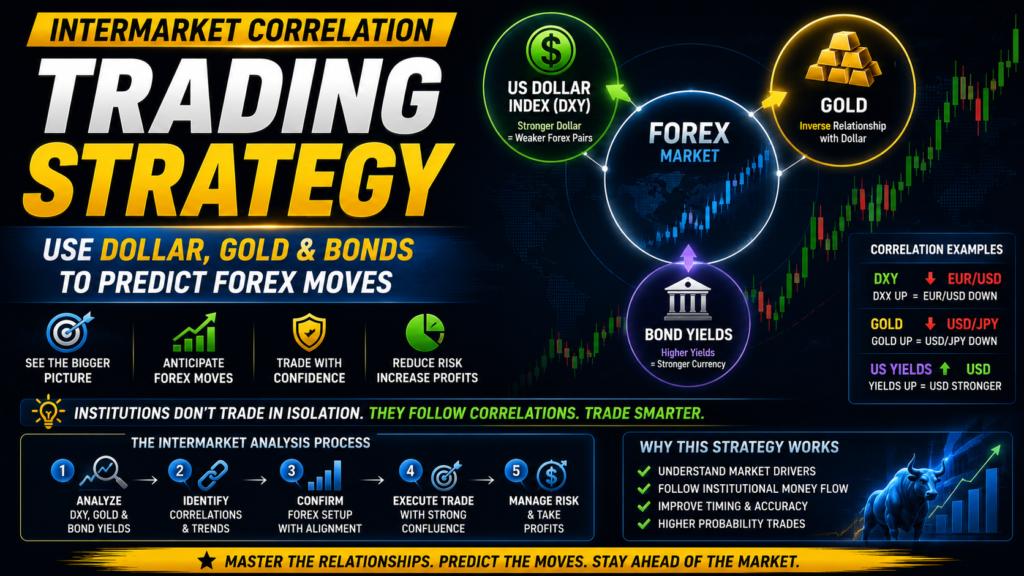
Forex trading is influenced by much more than chart patterns and indicators. Behind every major market move, there are relationships between different financial markets that help institutions predict future price direction. Professional traders do not analyze currency pairs in isolation. Instead, they study how assets like the US Dollar Index, gold, bonds, and stock markets interact with currencies. This approach is known as intermarket analysis. Understanding these relationships allows traders to anticipate market movement with greater confidence and precision. This is where intermarket correlation trading strategy, forex market correlation analysis, and dollar gold bond trading strategy become essential. Most beginner traders focus only on a single chart without understanding the bigger financial picture. As a result, they often miss important clues that institutional traders use every day. For example, movements in the US dollar or bond yields can strongly influence EUR/USD and GBP/USD. Gold prices can reveal risk sentiment and inflation expectations. By mastering intermarket correlation trading strategy, forex market correlation analysis, and dollar gold bond trading strategy, traders can improve decision-making and align with institutional market behavior. What is Intermarket Analysis Intermarket analysis studies the relationship between different financial markets. Instead of analyzing forex pairs alone, traders observe how currencies interact with commodities, bonds, indices, and interest rates. These relationships help traders understand market sentiment, capital flow, and institutional positioning. Understanding intermarket analysis is the foundation of intermarket correlation trading strategy, forex market correlation analysis, and dollar gold bond trading strategy. Understanding Market Correlation Correlation refers to the relationship between two financial assets. A positive correlation means two assets move in the same direction.A negative correlation means they move in opposite directions. For example, the US dollar and gold often have a negative correlation. When the dollar strengthens, gold frequently weakens. Understanding correlation is essential for intermarket correlation trading strategy, forex market correlation analysis, and dollar gold bond trading strategy. Why Institutions Use Intermarket Analysis Institutions trade based on macroeconomic conditions and capital flow. They analyze multiple markets together to identify opportunities and manage risk. A forex move rarely happens without influence from interest rates, bond yields, or economic sentiment. Understanding this institutional approach improves intermarket correlation trading strategy, forex market correlation analysis, and dollar gold bond trading strategy. The Role of the US Dollar Index (DXY) The US Dollar Index, also known as DXY, measures the strength of the US dollar against major currencies. When DXY rises, the US dollar generally strengthens. When DXY falls, the dollar weakens. Because EUR/USD has a large weight in DXY, the pair often moves inversely to the index. Understanding DXY behavior is central to intermarket correlation trading strategy, forex market correlation analysis, and dollar gold bond trading strategy. How DXY Influences Forex Pairs Many forex pairs are directly affected by the dollar. EUR/USD and GBP/USD usually move opposite to DXY.USD/JPY often moves with dollar strength and bond yields.Commodity currencies like AUD/USD are influenced by risk sentiment and dollar movement. Understanding these relationships improves intermarket correlation trading strategy, forex market correlation analysis, and dollar gold bond trading strategy. Gold and Forex Market Relationship Gold is one of the most important correlated assets in forex trading. Gold often has a negative correlation with the US dollar. When investors lose confidence in the dollar, gold prices tend to rise. Gold also reacts to inflation expectations, interest rates, and economic uncertainty. Understanding gold behavior strengthens intermarket correlation trading strategy, forex market correlation analysis, and dollar gold bond trading strategy. Why Gold and Dollar Move Oppositely Gold is priced in US dollars globally. When the dollar strengthens, gold becomes more expensive for international buyers, reducing demand. When the dollar weakens, gold becomes more attractive as a store of value. This inverse relationship supports intermarket correlation trading strategy, forex market correlation analysis, and dollar gold bond trading strategy. Understanding Bond Markets Bonds are another major factor influencing forex markets. Government bonds represent debt instruments issued by countries. Bond yields reflect investor expectations regarding inflation, interest rates, and economic growth. Institutions closely monitor bond yields to predict currency strength. Understanding bonds is essential for intermarket correlation trading strategy, forex market correlation analysis, and dollar gold bond trading strategy. Bond Yields and Currency Strength Higher bond yields often strengthen a currency because investors seek better returns. For example, rising US Treasury yields usually strengthen the US dollar. Lower yields can weaken the currency because investors look for better opportunities elsewhere. This relationship is a major component of intermarket correlation trading strategy, forex market correlation analysis, and dollar gold bond trading strategy. Interest Rates and Market Correlation Interest rates influence capital flow globally. When central banks raise interest rates, foreign investors may move capital into that currency for better returns. This strengthens the currency and affects correlated markets like gold and bonds. Understanding interest rate relationships improves intermarket correlation trading strategy, forex market correlation analysis, and dollar gold bond trading strategy. Risk-On and Risk-Off Market Behavior Financial markets shift between risk-on and risk-off sentiment. During risk-on conditions, investors prefer stocks and higher-yield currencies.During risk-off conditions, investors move toward safe-haven assets like gold, bonds, and the US dollar. Recognizing these shifts helps traders anticipate market direction. This insight supports intermarket correlation trading strategy, forex market correlation analysis, and dollar gold bond trading strategy. EUR/USD and DXY Correlation EUR/USD is strongly negatively correlated with DXY. If DXY shows strong bullish momentum, EUR/USD often weakens. Institutional traders use DXY confirmation before entering EUR/USD trades. Understanding this relationship strengthens intermarket correlation trading strategy, forex market correlation analysis, and dollar gold bond trading strategy. GBP/USD and Market Sentiment GBP/USD is heavily influenced by both the US dollar and market sentiment. Strong dollar strength usually pressures GBP/USD downward. Risk-on environments often support pound strength, while risk-off conditions favor the dollar. Understanding these dynamics improves intermarket correlation trading strategy, forex market correlation analysis, and dollar gold bond trading strategy. USD/JPY and Bond Yields USD/JPY is closely connected to US bond yields. When Treasury yields rise, USD/JPY often moves upward because higher yields attract investors into the dollar.
Trend Continuation Strategy with Pullback Entries: Ride Institutional Momentum
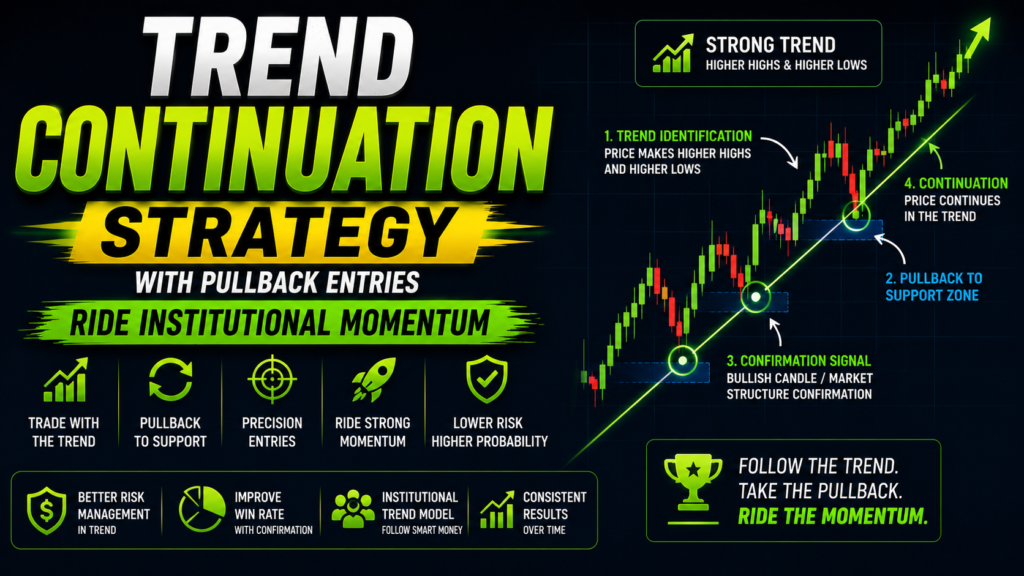
One of the biggest mistakes beginner traders make in forex trading is chasing price after a strong move has already happened. They enter trades late because of fear of missing out, only to watch the market retrace against them. Professional traders understand that the safest and most profitable entries usually come during pullbacks, not during impulsive moves. Institutions rarely enter trades after price has already expanded aggressively. Instead, they wait for retracements into important areas before continuing the trend. Understanding this concept can significantly improve trading accuracy and risk reward ratio. This is where trend continuation pullback strategy, institutional momentum trading, and forex pullback entry strategy become essential. Trend continuation trading focuses on joining an existing trend after a temporary retracement. Instead of predicting reversals, traders align themselves with the dominant market direction. This approach reduces emotional trading and increases the probability of success. By mastering trend continuation pullback strategy, institutional momentum trading, and forex pullback entry strategy, traders can learn to trade with smart money instead of reacting emotionally to price movement. Understanding Market Trends A trend is the general direction in which the market moves over time. An uptrend is formed by higher highs and higher lows.A downtrend is formed by lower highs and lower lows.A ranging market moves sideways without a clear direction. Identifying the trend correctly is the first step in successful trading. This concept forms the foundation of trend continuation pullback strategy, institutional momentum trading, and forex pullback entry strategy. Why Trends Continue Markets often move in trends because of institutional order flow. When institutions build positions, they usually do not enter all at once. They gradually add positions during pullbacks. Economic fundamentals, market sentiment, and liquidity also support ongoing trends. Understanding why trends continue helps traders apply trend continuation pullback strategy, institutional momentum trading, and forex pullback entry strategy more effectively. What is a Pullback A pullback is a temporary retracement against the main trend. In an uptrend, price may move downward briefly before continuing higher.In a downtrend, price may move upward temporarily before continuing lower. Pullbacks are natural and healthy because markets cannot move in one direction continuously. Understanding pullbacks is essential for trend continuation pullback strategy, institutional momentum trading, and forex pullback entry strategy. Difference Between Pullback and Reversal Many beginners confuse pullbacks with reversals. A pullback is temporary and occurs within the existing trend. A reversal indicates a complete change in market direction. Market structure helps traders identify the difference. If higher highs and higher lows remain intact, the trend is still bullish. Recognizing this distinction strengthens trend continuation pullback strategy, institutional momentum trading, and forex pullback entry strategy. Why Institutions Prefer Pullback Entries Institutions avoid chasing price because it increases risk. Instead, they wait for pullbacks into areas with better pricing and liquidity. This allows them to enter trades with smaller stop losses and better risk reward opportunities. Understanding institutional behavior improves trend continuation pullback strategy, institutional momentum trading, and forex pullback entry strategy. Role of Market Structure in Continuation Trading Market structure provides direction and confirmation. In an uptrend, traders should focus on buying pullbacks.In a downtrend, traders should focus on selling retracements. Breaks of structure confirm trend continuation and help traders avoid countertrend setups. This structure analysis supports trend continuation pullback strategy, institutional momentum trading, and forex pullback entry strategy. Liquidity and Pullbacks Pullbacks often occur because institutions seek liquidity before continuing the trend. Price may sweep short-term highs or lows to trigger stop losses and pending orders. Once liquidity is collected, the trend usually resumes. Understanding liquidity behavior enhances trend continuation pullback strategy, institutional momentum trading, and forex pullback entry strategy. Fair Value Gaps and Pullback Entries Fair value gaps are important tools for continuation trading. When price moves aggressively, imbalances are created in the market. Price often retraces into these fair value gaps before continuing in the trend direction. FVGs provide precise entry zones for pullback traders. This concept strengthens trend continuation pullback strategy, institutional momentum trading, and forex pullback entry strategy. Order Blocks in Trend Continuation Order blocks represent institutional accumulation or distribution zones. Bullish order blocks often act as support during uptrend pullbacks.Bearish order blocks act as resistance during downtrend retracements. Combining order blocks with pullback entries improves accuracy. This combination supports trend continuation pullback strategy, institutional momentum trading, and forex pullback entry strategy. Step-by-Step Trend Continuation Strategy The first step is identifying the higher timeframe trend. Next, traders wait for price to retrace into important areas such as fair value gaps, order blocks, or support resistance zones. Then, they look for confirmation such as rejection candles or break of structure. Once confirmation appears, traders enter in the direction of the trend. This process defines trend continuation pullback strategy, institutional momentum trading, and forex pullback entry strategy. Bullish Pullback Example EUR/USD is in a strong uptrend with clear higher highs and higher lows. Price retraces downward into a bullish order block and fair value gap. A liquidity sweep occurs below short-term lows, followed by bullish rejection candles. Price breaks structure upward, confirming continuation. Traders can enter buy trades with stops below the pullback low. This setup reflects trend continuation pullback strategy, institutional momentum trading, and forex pullback entry strategy. Bearish Pullback Example GBP/USD is moving downward in a strong trend. Price retraces upward into a bearish order block. A liquidity sweep occurs above short-term highs before price reverses downward. A bearish break of structure confirms the continuation. Traders can enter sell trades with proper risk management. This example demonstrates trend continuation pullback strategy, institutional momentum trading, and forex pullback entry strategy. Best Currency Pairs for Pullback Trading Certain currency pairs are especially effective for trend continuation trading. EUR/USD provides stable trends and reliable pullbacks.GBP/USD offers stronger volatility and momentum.XAU/USD creates powerful continuation setups during high liquidity sessions. Choosing the right markets improves trend continuation pullback strategy, institutional momentum trading, and forex pullback entry strategy. Best Timeframes for Continuation Trading Higher timeframes provide stronger trend direction. Lower timeframes provide precise entries. Many traders use
What is Fair Value Gap
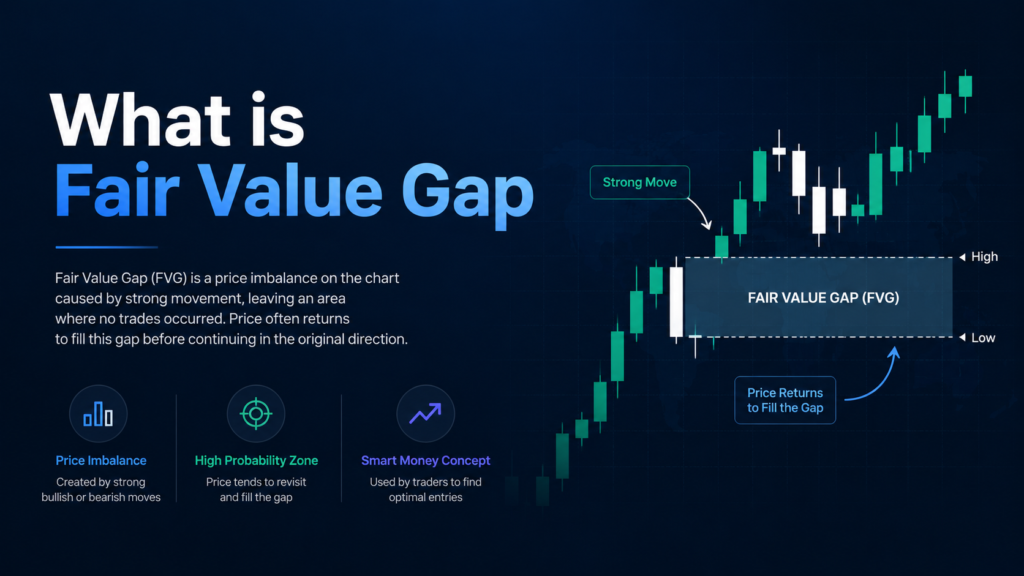
A Fair Value Gap (FVG) is a price imbalance zone on a chart where the market moved very fast in one direction, leaving an area where buying and selling did not happen properly. In simple words: Fair Value Gap means a gap/imbalance created when price moves too quickly, and later price may come back to that zone before continuing its move. How it forms in forex A Fair Value Gap usually forms with three candles. Bullish Fair Value Gap A bullish FVG forms when price moves sharply upward. It means buyers are very strong. Example: If EUR/USD moves strongly from 1.0800 to 1.0860, and during this move price leaves an imbalance between 1.0820 and 1.0840, that zone is called a bullish Fair Value Gap. Later, if price comes back to 1.0820–1.0840, buyers may enter again and price may move upward. Bearish Fair Value Gap A bearish FVG forms when price moves sharply downward. It means sellers are very strong. Example: If GBP/USD falls strongly from 1.2700 to 1.2640, and leaves an imbalance between 1.2660 and 1.2680, that zone is called a bearish Fair Value Gap. Later, if price retraces back to 1.2660–1.2680, sellers may enter again and price may move downward. Why traders use Fair Value Gap Forex traders use Fair Value Gap to find: Simple trading meaning Important point Fair Value Gap should not be used alone. It works better with: So, in short: Fair Value Gap is an imbalance area created by a strong price move. Traders wait for price to return to this area and then look for a possible trade in the direction of the main move. For More Information:- Instagram: https://www.instagram.com/hadyjfx_officialYouTube: https://www.youtube.com/@hadyjmentor7793Facebook: https://www.facebook.com/profile.php?id=61562232239915 Join Telegram: https://t.me/hadyjfx
News Manipulation Trading Strategy: How Institutions Move the Market During High Impact Events
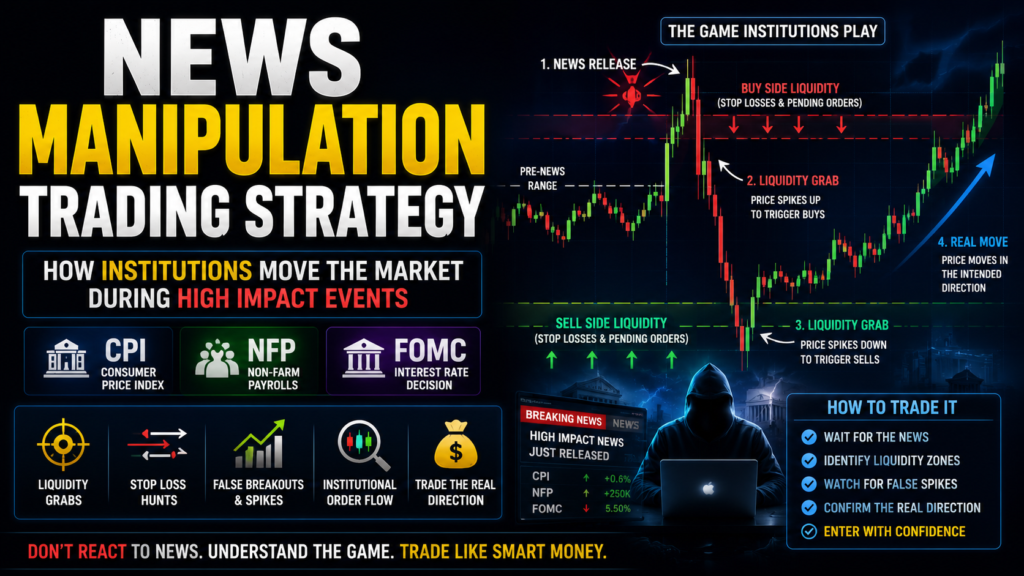
High-impact news events are some of the most exciting and dangerous moments in the forex market. During events like CPI releases, Non-Farm Payrolls (NFP), and FOMC meetings, the market can move hundreds of pips within minutes. Most beginner traders believe these moves are random reactions to economic data, but professional traders understand that institutions often use news volatility to create liquidity and manipulate price movements. This is where news manipulation trading strategy, post-news liquidity grab forex, and smart money news trading become essential. Many retail traders lose money during news events because they chase volatility without understanding how the market behaves. Institutions know where retail traders place their stop losses and pending orders. They use sudden volatility spikes to collect liquidity before moving price in the real direction. By mastering news manipulation trading strategy, post-news liquidity grab forex, and smart money news trading, traders can avoid emotional mistakes and trade alongside institutional flow. Understanding High Impact News Events High-impact news events are economic releases that significantly affect financial markets. Examples include CPI inflation reports, Non-Farm Payrolls data, FOMC interest rate decisions, GDP releases, and unemployment reports. These events increase volatility because traders and institutions react to new economic information. Understanding news behavior is essential for news manipulation trading strategy, post-news liquidity grab forex, and smart money news trading. Why News Creates Extreme Volatility News events create uncertainty in the market. When important data is released, traders quickly adjust their positions based on expectations and economic outlook. Institutions take advantage of this sudden increase in activity and liquidity. As a result, price can move aggressively in both directions before settling into a trend. This volatility forms the foundation of news manipulation trading strategy, post-news liquidity grab forex, and smart money news trading. How Institutions Use News Events Institutions rarely trade news emotionally. Instead, they use volatility to create opportunities. They understand that retail traders often place pending orders above and below key levels before major events. When news is released, institutions push price into these liquidity zones to trigger stop losses and breakout orders. After collecting liquidity, the market often reverses or continues in the intended direction. This process is central to news manipulation trading strategy, post-news liquidity grab forex, and smart money news trading. What is a Post-News Liquidity Grab A post-news liquidity grab happens when price aggressively spikes into a liquidity zone immediately after a news release. This move traps breakout traders and triggers stop losses. Once liquidity is collected, price frequently reverses sharply. Understanding this behavior is critical for news manipulation trading strategy, post-news liquidity grab forex, and smart money news trading. CPI Events and Market Manipulation Consumer Price Index, or CPI, measures inflation and heavily impacts currencies. If inflation data is stronger than expected, traders may expect interest rate hikes, strengthening the currency. However, institutions often create fake moves immediately after the release before the real trend begins. Price may spike upward, collect buy-side liquidity, and then reverse downward. Recognizing these patterns improves news manipulation trading strategy, post-news liquidity grab forex, and smart money news trading. NFP Volatility Explained Non-Farm Payrolls is one of the most volatile news events in forex. The release impacts the US dollar because it reflects employment strength in the economy. NFP often creates massive liquidity sweeps because traders expect explosive movement. Institutions frequently use this volatility to trap retail traders before establishing the actual direction. Understanding NFP behavior strengthens news manipulation trading strategy, post-news liquidity grab forex, and smart money news trading. FOMC and Interest Rate Decisions FOMC meetings are among the most important events in financial markets. Interest rate decisions and central bank statements influence long-term market expectations. Price often becomes extremely volatile during these announcements. Institutions use this uncertainty to create liquidity grabs and false breakouts. Understanding FOMC volatility is essential for news manipulation trading strategy, post-news liquidity grab forex, and smart money news trading. Liquidity During News Events Liquidity increases dramatically during major news releases. Retail traders place breakout orders above highs and below lows expecting strong movement. Institutions target these liquidity zones because they provide the volume needed to execute large positions. Understanding liquidity behavior improves news manipulation trading strategy, post-news liquidity grab forex, and smart money news trading. Why Retail Traders Get Trapped Most retail traders react emotionally during news events. Fear of missing out causes traders to chase momentum.Greed encourages overleveraging.Panic leads to poor decision-making. Institutions exploit these emotions by creating rapid price spikes. Recognizing this psychology helps traders apply news manipulation trading strategy, post-news liquidity grab forex, and smart money news trading more effectively. How to Identify News Manipulation News manipulation often follows recognizable patterns. Price spikes aggressively into liquidity zones.Large wicks appear on candles.The market reverses shortly after the spike.Breakouts fail quickly. These signals help traders identify manipulation and improve news manipulation trading strategy, post-news liquidity grab forex, and smart money news trading. Step-by-Step News Trading Strategy The first step is identifying major upcoming news events. Next, traders mark key liquidity zones such as equal highs, equal lows, and important support or resistance levels. During the news release, traders observe price behavior instead of entering immediately. If price sweeps liquidity and reverses, traders wait for confirmation such as break of structure. Then, they enter trades in the new direction with controlled risk. This process defines news manipulation trading strategy, post-news liquidity grab forex, and smart money news trading. Bullish Post-News Setup Example Price is approaching equal lows before an NFP release. After the data is released, price spikes downward, sweeping sell-side liquidity. Shortly afterward, price reverses strongly upward and breaks structure. Traders can enter buy positions after confirmation with stops below the sweep. This setup reflects news manipulation trading strategy, post-news liquidity grab forex, and smart money news trading. Bearish Post-News Setup Example Price is trading below equal highs before a CPI release. After the announcement, price spikes upward into buy-side liquidity. The breakout fails, and price reverses downward aggressively. A bearish break of structure confirms the move. This example demonstrates news manipulation
Forex Scalping Strategy Using Smart Money Concepts
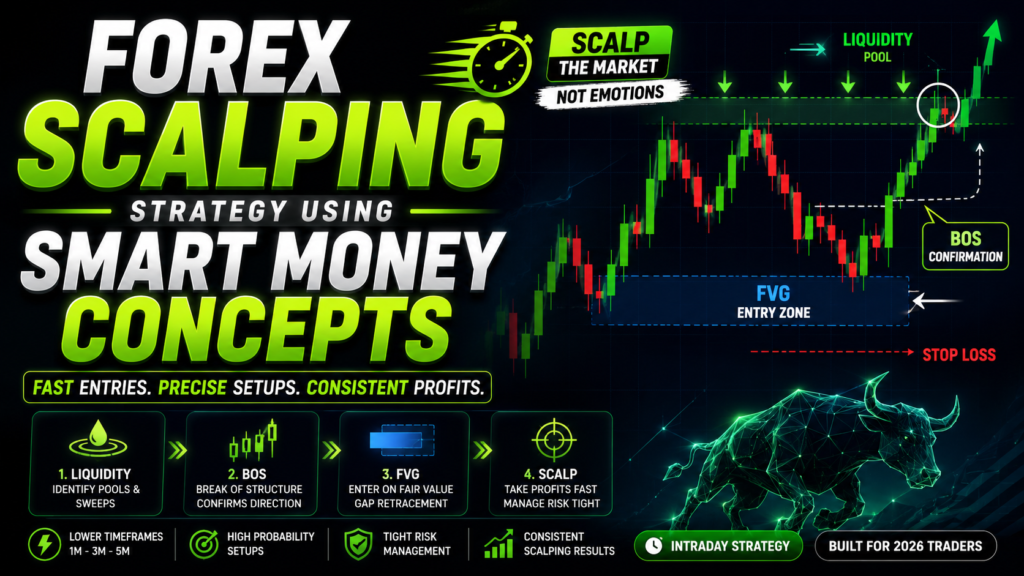
Forex scalping has become one of the most popular trading styles among modern traders because it focuses on fast entries, quick profits, and multiple trading opportunities within a single day. However, many beginners fail in scalping because they rely only on indicators and random signals without understanding how the market truly works. Professional scalpers focus on price action, liquidity, and institutional behavior. This is where smart money concepts completely change the game. By understanding liquidity, break of structure, and fair value gaps, traders can improve entry timing and reduce unnecessary losses. This is why forex scalping strategy smart money, liquidity scalping forex, and BOS FVG scalping strategy are becoming highly popular among 2026 traders. Most retail scalpers enter trades emotionally and chase momentum after the move has already started. Smart money traders do the opposite. They wait patiently for liquidity grabs, market structure shifts, and precise confirmations before entering trades. By mastering forex scalping strategy smart money, liquidity scalping forex, and BOS FVG scalping strategy, traders can gain a major advantage in fast-moving markets. Understanding Forex Scalping Scalping is a short-term trading style where traders aim to capture small price movements multiple times throughout the day. Scalpers usually trade on lower timeframes such as the 1-minute, 3-minute, or 5-minute charts. Trades may last only a few minutes. The goal is not to catch huge market trends but to take advantage of quick momentum moves with controlled risk. Understanding the basics of scalping is essential for forex scalping strategy smart money, liquidity scalping forex, and BOS FVG scalping strategy. Why Smart Money Concepts Improve Scalping Traditional scalping strategies often rely on lagging indicators, which generate delayed signals. Smart money concepts focus on how institutions move price. Instead of reacting late, traders learn to anticipate market behavior. Liquidity, break of structure, and fair value gaps provide real-time market information. This makes smart money concepts highly effective for forex scalping strategy smart money, liquidity scalping forex, and BOS FVG scalping strategy. What is Liquidity in Scalping Liquidity represents price areas where a significant number of buy and sell orders are concentrated. On lower timeframes, liquidity often forms above short-term highs and below short-term lows. Institutions target these zones because they need liquidity to execute large positions. Understanding liquidity is one of the most important parts of forex scalping strategy smart money, liquidity scalping forex, and BOS FVG scalping strategy. Liquidity Sweeps Explained A liquidity sweep happens when price moves aggressively into a liquidity zone before reversing. For example, price may briefly move above a short-term high to trigger stop losses before dropping sharply. These sweeps trap retail traders and create opportunities for smart money entries. Recognizing liquidity sweeps improves forex scalping strategy smart money, liquidity scalping forex, and BOS FVG scalping strategy. Break of Structure in Scalping Break of structure, also known as BOS, confirms market direction. In bullish market conditions, price typically develops a sequence of rising highs and rising lows. A bullish BOS occurs when price breaks above a previous high. In a downtrend, price breaks below previous lows. Using BOS helps traders avoid guessing market direction. This concept strengthens forex scalping strategy smart money, liquidity scalping forex, and BOS FVG scalping strategy. What is a Fair Value Gap A fair value gap, or FVG, is an imbalance created when price moves aggressively. This creates a gap between candles where price traded inefficiently. Price often returns to these areas before continuing its move. FVGs provide excellent entry opportunities for scalpers. Understanding fair value gaps is essential for forex scalping strategy smart money, liquidity scalping forex, and BOS FVG scalping strategy. How Smart Money Scalping Works Smart money scalping follows a structured process. First, traders identify liquidity zones on lower timeframes. Next, they wait for price to sweep liquidity. Then, they look for a break of structure confirming reversal or continuation. Finally, they use fair value gaps for precise entries. This process defines forex scalping strategy smart money, liquidity scalping forex, and BOS FVG scalping strategy. Best Timeframes for Scalping Lower timeframes are ideal for scalping. The 1-minute chart provides fast entries but contains more noise.The 3-minute chart balances speed and clarity.The 5-minute chart offers stronger confirmation. Many traders combine multiple timeframes for better analysis. This method strengthens trade accuracy by combining liquidity analysis, market structure confirmation, and fair value gap execution for scalping setups. Best Trading Sessions for Scalping The best scalping opportunities usually occur during high-liquidity sessions. The London session provides strong volatility and movement.The New York session creates additional momentum and reversals.The overlap between London and New York sessions is especially powerful. Trading during active sessions improves forex scalping strategy smart money, liquidity scalping forex, and BOS FVG scalping strategy. Step-by-Step Scalping Strategy The first step is identifying the overall market direction. Next, traders mark liquidity zones such as equal highs and equal lows. They wait for price to sweep liquidity and create a reaction. A break of structure confirms direction. Then, traders enter using a fair value gap retracement. This structured method is central to forex scalping strategy smart money, liquidity scalping forex, and BOS FVG scalping strategy. Bullish Scalping Example Price is trending upward on the 5-minute chart. On the 1-minute chart, price sweeps short-term lows and immediately reverses upward. A bullish break of structure confirms strength. Price retraces into a fair value gap, providing entry confirmation. Traders can enter buy trades with stops below the liquidity sweep. This setup reflects forex scalping strategy smart money, liquidity scalping forex, and BOS FVG scalping strategy. Bearish Scalping Example Price is moving downward on the higher timeframe. On the lower timeframe, price sweeps short-term highs before reversing downward. A bearish BOS confirms market direction. Price retraces into a fair value gap, creating a precise entry opportunity. This example demonstrates forex scalping strategy smart money, liquidity scalping forex, and BOS FVG scalping strategy. Risk Management in Scalping Risk management is extremely important in scalping because trades happen quickly. Stop losses should be small and logical.Position size should remain controlled.Risk
Dynamic Support & Resistance Flip Strategy: Trade Market Rejections Like a Pro
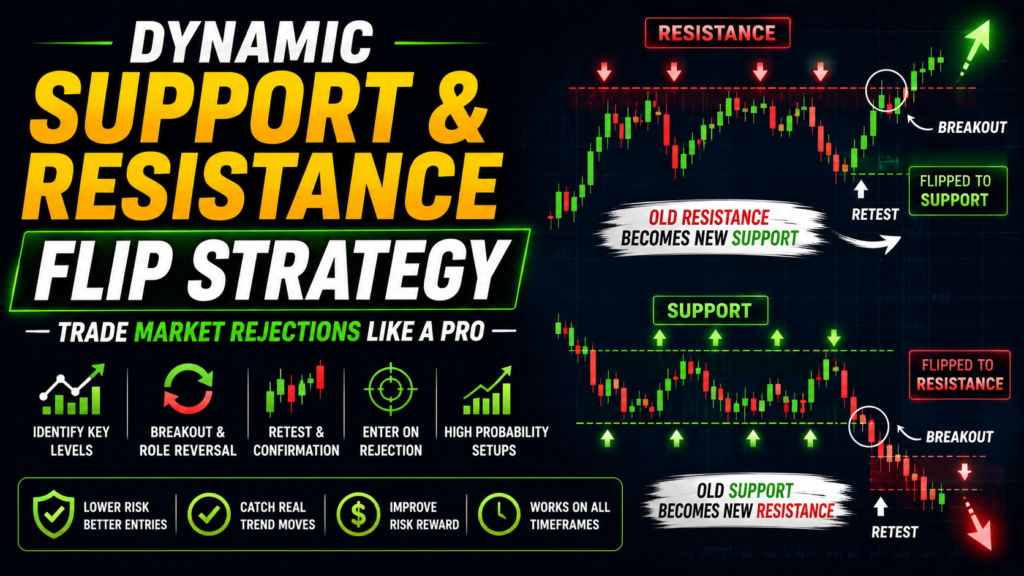
Support and resistance are among the most important concepts in forex trading. Almost every trader has heard about these levels, but very few truly understand how they work in live market conditions. Most beginner traders treat support and resistance as fixed lines, while professional traders understand that these levels are dynamic and constantly changing. One of the most powerful concepts in price action trading is the support and resistance flip. This happens when a broken resistance becomes support or when broken support turns into resistance. Understanding this behavior can significantly improve trading accuracy and timing. This is where dynamic support resistance strategy, breakout retest trading, and market rejection forex trading become essential. Many traders make the mistake of entering trades immediately after a breakout. However, professional traders often wait for price to retest the broken level before entering. This retest provides confirmation that the market accepts the new direction. By mastering dynamic support resistance strategy, breakout retest trading, and market rejection forex trading, traders can avoid false breakouts and improve consistency. Understanding Support and Resistance Support is a price level where buying pressure is strong enough to stop price from falling further. Resistance is a level where selling pressure prevents price from rising higher. These levels are formed because traders react emotionally around certain prices. Buyers often enter near support, while sellers enter near resistance. Support and resistance levels are not exact lines. They are zones where price reactions are likely to occur. Understanding these basics is essential for dynamic support resistance strategy, breakout retest trading, and market rejection forex trading. Why Support and Resistance Matter Support and resistance levels represent important decision areas in the market. Institutions often place large orders around these zones. Retail traders also focus on them because they are easy to identify. As a result, price frequently reacts strongly at these levels. These reactions create trading opportunities that form the basis of dynamic support resistance strategy, breakout retest trading, and market rejection forex trading. What is a Support Resistance Flip A support resistance flip occurs when a broken level changes its role. When price breaks above resistance, that resistance may later act as support. When price breaks below support, that support may later become resistance. This role reversal happens because market participants change their behavior after the breakout. Understanding this concept is central to dynamic support resistance strategy, breakout retest trading, and market rejection forex trading. Why Role Reversal Happens Role reversal is driven by market psychology and order flow. For example, traders who missed a breakout may wait for a retest to enter trades. Traders who were trapped on the wrong side may also exit positions during the retest. This creates buying or selling pressure around the flipped level. Institutions use these reactions to continue market momentum. This behavior supports dynamic support resistance strategy, breakout retest trading, and market rejection forex trading. Difference Between Static and Dynamic Levels Static support and resistance are fixed horizontal levels. Dynamic support and resistance change over time and can include trendlines, moving averages, and evolving market zones. Professional traders focus more on dynamic market behavior rather than fixed lines. Understanding this difference improves dynamic support resistance strategy, breakout retest trading, and market rejection forex trading. How to Identify Strong Levels Not every support and resistance zone carries the same value in the forex market. Some levels become highly important because price reacts there repeatedly over time. When the market respects a level multiple times, traders and institutions begin paying closer attention to it. Higher timeframe levels usually have stronger influence because they reflect broader market participation and institutional order flow. These zones often attract liquidity and become key decision areas for smart money activity. A well-respected level can create powerful breakout and retest opportunities once price finally moves beyond it. Understanding how to identify these major zones helps traders improve dynamic support resistance strategy, breakout retest trading, and market rejection forex trading. Breakout Trading Explained A breakout happens when price moves beyond a key support or resistance level. This usually indicates strong momentum and increased market participation. However, not every breakout is genuine. Some breakouts fail and reverse quickly. Understanding breakout behavior is important for dynamic support resistance strategy, breakout retest trading, and market rejection forex trading. The Importance of Retests Professional traders often avoid entering immediately after a breakout. Instead, they wait for price to return and retest the broken level. A successful retest confirms that the market accepts the new direction. This approach reduces risk and improves entry accuracy. It is a core principle of dynamic support resistance strategy, breakout retest trading, and market rejection forex trading. How to Trade a Bullish Support Flip Price breaks above a major resistance level with strong momentum. Instead of buying immediately, traders wait for price to return to the broken resistance. If price rejects the level and starts moving upward again, the level has flipped into support. Traders can enter buy positions after confirmation. This setup reflects dynamic support resistance strategy, breakout retest trading, and market rejection forex trading. How to Trade a Bearish Resistance Flip Price breaks below a strong support level. After the breakout, price retraces upward to retest the broken support. If the market rejects the level and moves downward, the level has flipped into resistance. Traders can enter sell trades with proper risk management. This example demonstrates dynamic support resistance strategy, breakout retest trading, and market rejection forex trading. Market Rejection Candles Explained Rejection candles are powerful signals around support and resistance flips. Long wicks show that the market attempted to move in one direction but failed. Bullish rejection candles often appear at support. Bearish rejection candles appear near resistance. These candles provide confirmation for entries. They strengthen dynamic support resistance strategy, breakout retest trading, and market rejection forex trading. Break of Structure Confirmation Break of structure confirms that the market direction has changed. For example, after a bullish retest, price breaking a previous high confirms strength. Similarly, after a bearish retest, breaking a
Institutional Liquidity Mapping Strategy: Find Where Smart Money Targets Price
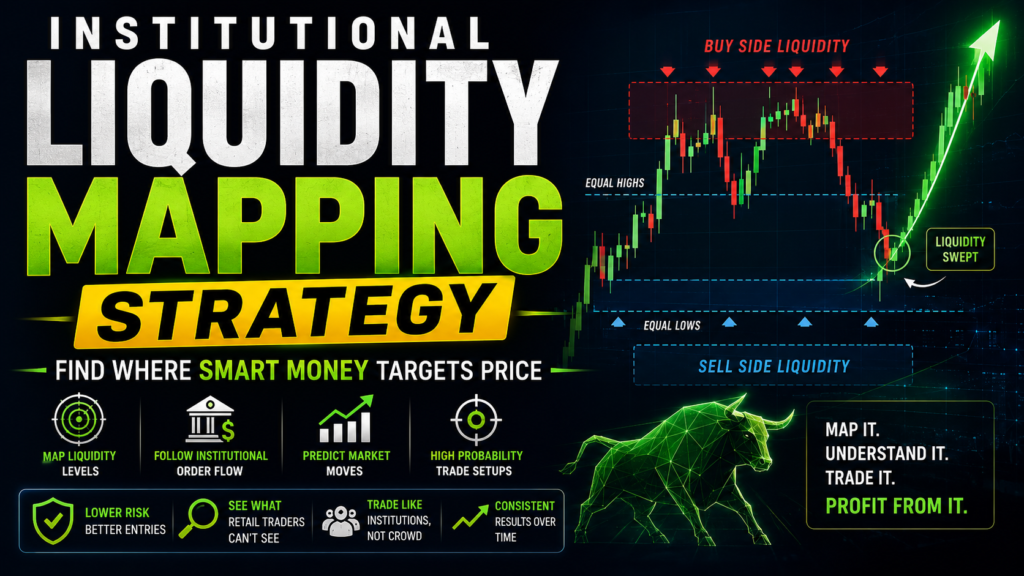
Forex trading is not random. Behind every major market move, there is usually a reason connected to liquidity and institutional activity. Most beginner traders focus only on indicators or candle patterns, while professional traders focus on where liquidity exists in the market. Institutions need liquidity to enter and exit large positions, and price often moves toward these areas before making its real move. Understanding this behavior can completely change the way traders view the market. This is where institutional liquidity mapping strategy, smart money liquidity trading, and forex liquidity pool analysis become essential. Many retail traders lose money because they place stop losses at predictable levels. Institutions understand where these orders are located and use them to their advantage. Price is often driven toward these liquidity zones before reversing or continuing its trend. By learning institutional liquidity mapping strategy, smart money liquidity trading, and forex liquidity pool analysis, traders can stop following the crowd and start understanding how professional money operates. Understanding Liquidity in Forex Trading Liquidity in forex refers to the availability of buy and sell orders in the market. A highly liquid market allows large transactions to happen smoothly without major price disruptions. In forex trading, liquidity is created by traders placing orders such as stop losses, pending entries, and take profits. Institutions target these areas because they need large volumes of orders to execute their trades efficiently. Without liquidity, large institutions cannot place their positions without causing major market imbalance. This is why price constantly seeks liquidity zones. This concept forms the core of institutional liquidity mapping strategy, smart money liquidity trading, and forex liquidity pool analysis. What Are Liquidity Pools Liquidity pools are areas where a large number of orders are concentrated. These areas usually exist above equal highs, below equal lows, near support and resistance levels, and around psychological price zones. Retail traders often place stop losses in these locations because they appear obvious on the chart. Institutions know this behavior and target these levels to collect liquidity. Understanding liquidity pools is essential for institutional liquidity mapping strategy, smart money liquidity trading, and forex liquidity pool analysis. Why Smart Money Targets Liquidity Institutions trade with extremely large positions. To execute these trades, they require liquidity. For example, if an institution wants to place a large sell order, it needs enough buyers in the market. This is why price is often pushed upward first to trigger buy stops and attract buyers before reversing downward. This process allows institutions to fill their orders without creating excessive slippage. This behavior is the foundation of institutional liquidity mapping strategy, smart money liquidity trading, and forex liquidity pool analysis. Difference Between Retail Trading and Institutional Trading Retail traders often focus on indicators and emotional decisions. Institutions focus on liquidity and order flow. Retail traders chase breakouts, while institutions often create fake breakouts to capture liquidity. Retail traders react to price movement. Institutions create the movement itself. Understanding this difference helps traders apply institutional liquidity mapping strategy, smart money liquidity trading, and forex liquidity pool analysis more effectively. Types of Liquidity in Forex There are mainly two types of liquidity in forex trading. Buy-side liquidity exists above highs where buy stop orders are located. Sell-side liquidity exists below lows where sell stop orders are placed. Institutions target both types depending on market conditions. Recognizing these liquidity zones improves institutional liquidity mapping strategy, smart money liquidity trading, and forex liquidity pool analysis. Equal Highs and Equal Lows Equal highs and equal lows are among the most important liquidity areas. When price forms multiple highs at the same level, traders often place stop losses above them. This creates buy-side liquidity. Similarly, equal lows create sell-side liquidity because traders place stops below these levels. Price frequently moves into these areas before reversing. This behavior is a major part of institutional liquidity mapping strategy, smart money liquidity trading, and forex liquidity pool analysis. Liquidity Sweeps Explained A liquidity sweep occurs when price aggressively moves into a liquidity zone and then quickly reverses. This move triggers stop losses and pending orders, creating liquidity for institutions. Liquidity sweeps are often mistaken for genuine breakouts by beginner traders. Understanding liquidity sweeps is crucial for institutional liquidity mapping strategy, smart money liquidity trading, and forex liquidity pool analysis. Market Structure and Liquidity Market structure helps traders understand the overall direction of the market. In an uptrend, institutions often sweep sell-side liquidity before continuing upward. In a downtrend, they often target buy-side liquidity before continuing lower. Liquidity sweeps combined with market structure provide powerful confirmation. This combination strengthens institutional liquidity mapping strategy, smart money liquidity trading, and forex liquidity pool analysis. How Institutions Manipulate Price Institutions manipulate price to create liquidity. They may create false breakouts to attract retail traders into bad positions. Once enough liquidity is available, the market reverses. This manipulation is not illegal—it is part of how financial markets function. Understanding this behavior allows traders to align with institutional activity through institutional liquidity mapping strategy, smart money liquidity trading, and forex liquidity pool analysis. Liquidity Mapping Strategy Explained Liquidity mapping involves identifying where liquidity exists before entering trades. Traders mark key highs, lows, equal highs, equal lows, and important support or resistance zones. They then observe how price reacts around these areas. Instead of reacting emotionally, traders anticipate where institutions are likely to move price next. This approach defines institutional liquidity mapping strategy, smart money liquidity trading, and forex liquidity pool analysis. Step-by-Step Liquidity Mapping Process The first step is identifying market structure. Next, traders mark major liquidity zones on the chart. Then, they wait for price to approach these areas. Instead of entering immediately, they observe price action for confirmation. If price sweeps liquidity and shows reversal signs, traders can enter positions with proper risk management. This structured method is central to institutional liquidity mapping strategy, smart money liquidity trading, and forex liquidity pool analysis. Entry Confirmation Techniques Confirmation is extremely important in liquidity trading. Traders should look for rejection candles with long wicks. Break
Volatility Expansion Strategy: Catch Explosive Moves After Consolidation
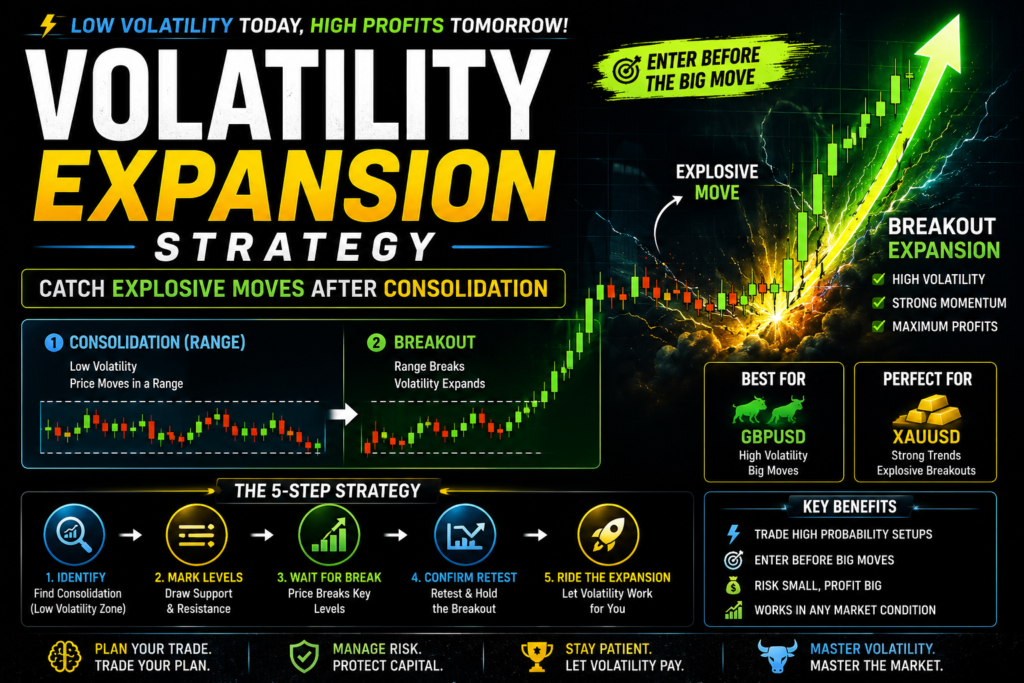
In forex trading, the biggest profits are often made during strong and fast price movements. However, these explosive moves do not happen randomly. They are usually preceded by a period of low volatility where the market moves in a tight range. This phase is known as consolidation. When the market breaks out of this range, volatility increases rapidly, creating powerful trading opportunities. This concept is called volatility expansion. Understanding how to trade this transition can give traders a major advantage. This is where volatility expansion trading strategy, breakout forex strategy, and consolidation to expansion trading become essential. Most traders enter trades too late, after the move has already started. By that time, risk increases and reward decreases. Professional traders focus on identifying consolidation phases early and positioning themselves before the breakout. By mastering volatility expansion trading strategy, breakout forex strategy, and consolidation to expansion trading, traders can capture high-probability setups with strong momentum. What is Volatility in Forex Volatility refers to the speed and magnitude of price movement in the market. High volatility means large price swings, while low volatility indicates slow and steady movement. In forex, volatility changes throughout the day based on market activity, economic news, and liquidity. Understanding volatility helps traders identify when the market is likely to move aggressively. This concept forms the foundation of volatility expansion trading strategy, breakout forex strategy, and consolidation to expansion trading. What is Consolidation Phase Consolidation is a period where price moves within a narrow range without a clear trend. During this phase, buyers and sellers are in balance. Price fluctuates between support and resistance levels. This phase often occurs before major market moves. It represents a buildup of orders and liquidity. Recognizing consolidation is essential for applying volatility expansion trading strategy, breakout forex strategy, and consolidation to expansion trading. Why Consolidation Leads to Expansion Consolidation creates a buildup of pressure in the market. As orders accumulate within the range, liquidity increases above highs and below lows. Eventually, the market breaks out of the range, releasing this pressure. This leads to a sharp and fast move known as volatility expansion. This behavior is central to volatility expansion trading strategy, breakout forex strategy, and consolidation to expansion trading. Characteristics of Strong Consolidation Not all consolidation phases lead to strong breakouts. Traders must identify high-quality setups. Strong consolidation has tight price ranges and low volatility. It often occurs after a trend or before major news events. There are multiple touches of support and resistance levels. Volume may decrease before the breakout. These characteristics help traders apply volatility expansion trading strategy, breakout forex strategy, and consolidation to expansion trading effectively. Types of Breakouts There are different types of breakouts that occur after consolidation. A continuation breakout happens in the direction of the existing trend. A reversal breakout occurs when the market changes direction. A false breakout happens when price breaks the range but quickly returns. Understanding these types improves accuracy in volatility expansion trading strategy, breakout forex strategy, and consolidation to expansion trading. Best Market Conditions for This Strategy Volatility expansion works best in certain conditions. It performs well during London and New York sessions when liquidity is high. It is effective during major economic events. It works best on highly volatile pairs like GBP/USD and gold (XAU/USD). Choosing the right conditions enhances volatility expansion trading strategy, breakout forex strategy, and consolidation to expansion trading. Step-by-Step Volatility Expansion Strategy The first step is identifying a consolidation range. Mark the support and resistance levels where price is moving. Wait for a breakout from the range. Do not enter immediately. Look for confirmation such as strong momentum or structure break. Enter the trade in the direction of the breakout. This structured approach defines volatility expansion trading strategy, breakout forex strategy, and consolidation to expansion trading. Entry Before the Big Move One advanced technique is entering before the breakout. Traders analyze market behavior and anticipate the direction of the move. They may use indicators, price action, or smart money concepts for confirmation. This allows traders to enter early and maximize profit potential. This method is part of volatility expansion trading strategy, breakout forex strategy, and consolidation to expansion trading. Breakout Confirmation Techniques Confirmation is essential to avoid false breakouts. Strong candles indicate momentum. Break of structure confirms direction. Volume increase supports the move. Retest of breakout level provides safer entry. These signals improve accuracy in volatility expansion trading strategy, breakout forex strategy, and consolidation to expansion trading. Example of Bullish Expansion Trade Price consolidates in a range after an uptrend. It breaks above resistance with strong momentum. A retest of the breakout level confirms support. Traders can enter buy trades targeting higher levels. This setup reflects volatility expansion trading strategy, breakout forex strategy, and consolidation to expansion trading. Example of Bearish Expansion Trade Price moves sideways after a downtrend. It breaks below support with strong momentum. A retest confirms resistance. Traders can enter sell trades targeting lower levels. This example demonstrates volatility expansion trading strategy, breakout forex strategy, and consolidation to expansion trading. Risk Management in Breakout Trading Risk management is critical in volatility expansion trading. Stop losses should be placed inside the range or beyond key levels. Position size should be controlled to manage risk. Risk reward ratio should be favorable. Proper risk control supports volatility expansion trading strategy, breakout forex strategy, and consolidation to expansion trading. Multi-Timeframe Analysis Using multiple timeframes improves trade accuracy. Higher timeframes identify strong consolidation zones. Lower timeframes provide precise entry points. This approach enhances volatility expansion trading strategy, breakout forex strategy, and consolidation to expansion trading. Combining with Smart Money Concepts Volatility expansion becomes more powerful when combined with smart money concepts. Liquidity sweeps can indicate the true breakout direction. Order blocks provide entry zones. Fair value gaps confirm momentum. This combination strengthens volatility expansion trading strategy, breakout forex strategy, and consolidation to expansion trading. Common Mistakes Traders Make Many traders chase breakouts after the move has already happened. Another mistake is trading false breakouts without confirmation. Overtrading