Understand Bullish and Bearish Engulfing Pattern ?
Byhadyjfx
Candlestick patterns are widely used in technical analysis as visual indicators of potential trend reversals and continuation patterns. Two powerful patterns are the bullish engulfing and bearish engulfing candlesticks, each signaling a shift in market sentiment and potential reversal of trends. Recognizing these patterns can provide traders with valuable insight into future price movement and help them time their entry and exit points more effectively. This article will dive into the structure, interpretation, and practical applications of these two patterns in trading.
Understanding the Bullish Engulfing Candlestick Pattern
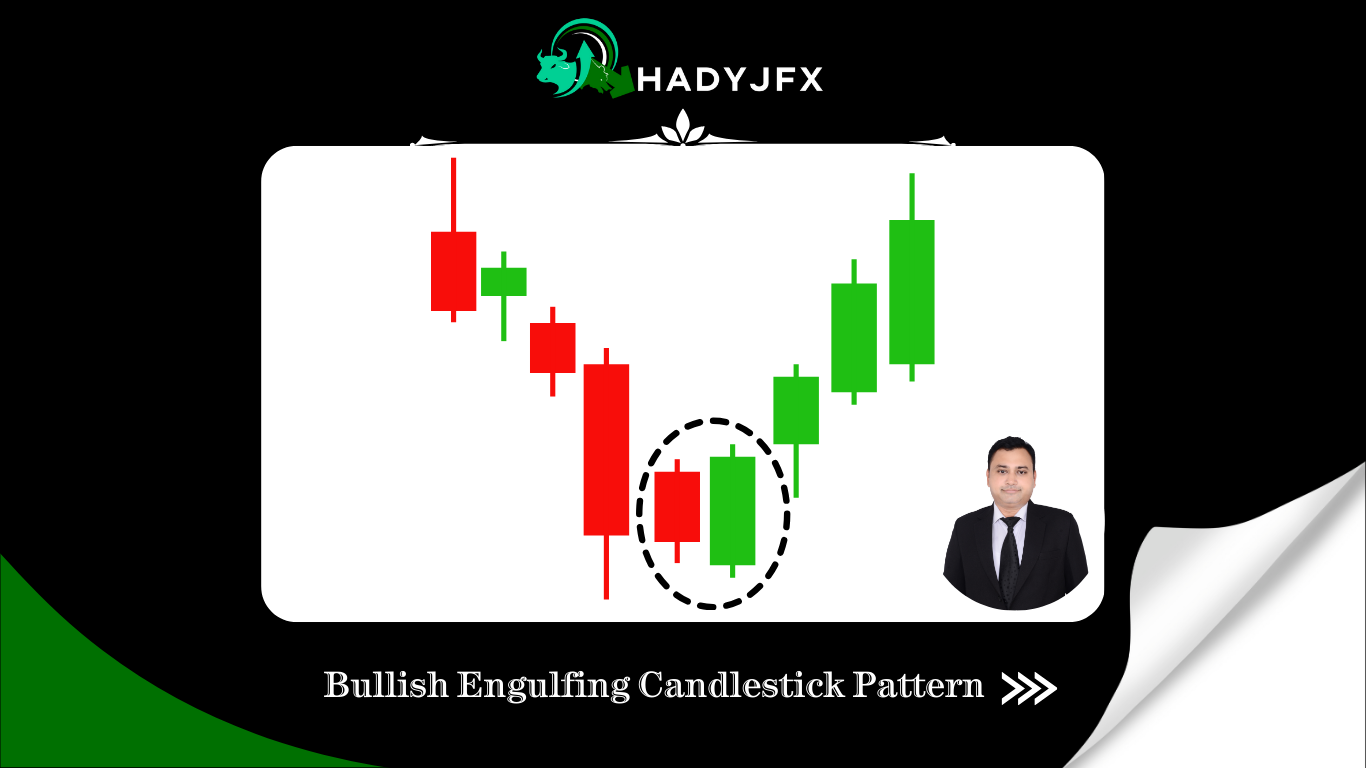
A two-candle pattern known as the bullish engulfing pattern typically signals the beginning of a potential uptrend and the end of a decline. The second candle’s body entirely engulfs or covers the body of the previous bearish (downward) candle, which is why this pattern is known as a “engulfing” pattern.
Pattern Structure:
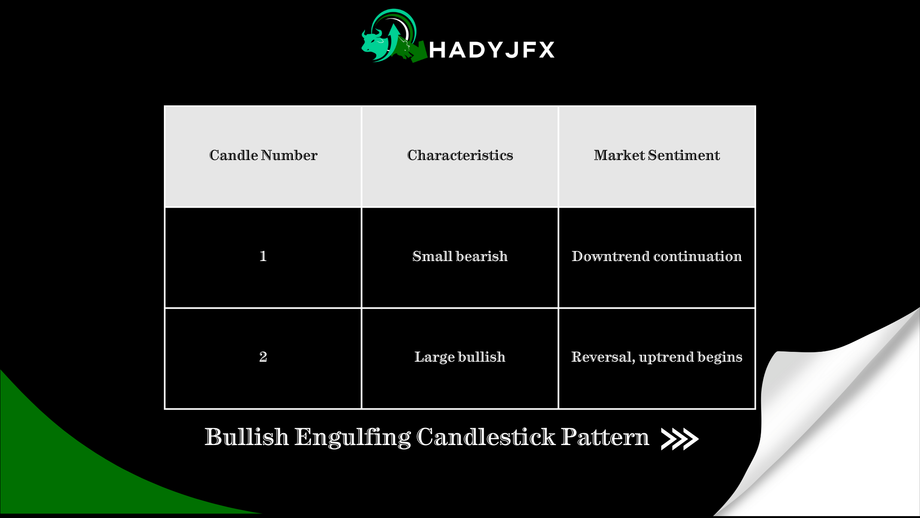
- First Candle: A small bearish candle (red or black) that continues the current downtrend.
- Second Candle: A large bullish candle (green or white) that opens lower than the first candle but closes higher, fully engulfing the body of the previous bearish candle.
When a bullish engulfing pattern appears, it signifies that buyers are entering the market and reversing the selling momentum. This shift in sentiment suggests that the trend might be reversing, creating a buying opportunity for traders.
Example Chart:
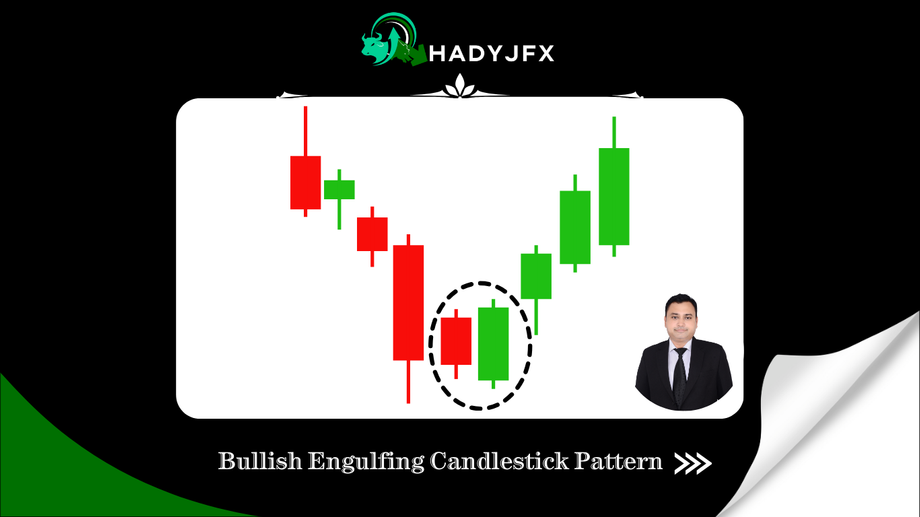
In the chart below, observe how the bullish engulfing pattern appears after a series of bearish candles, signaling a possible upward reversal.
Identifying the Bearish Engulfing Candlestick Pattern:
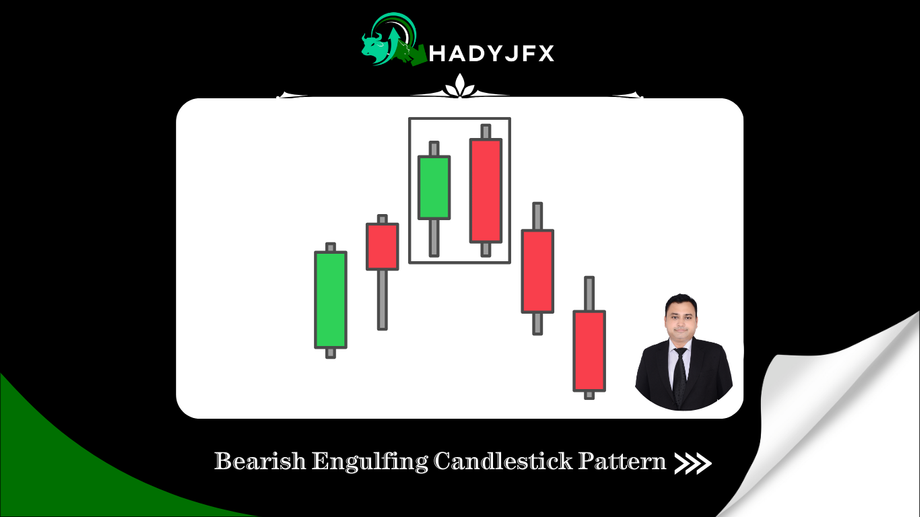
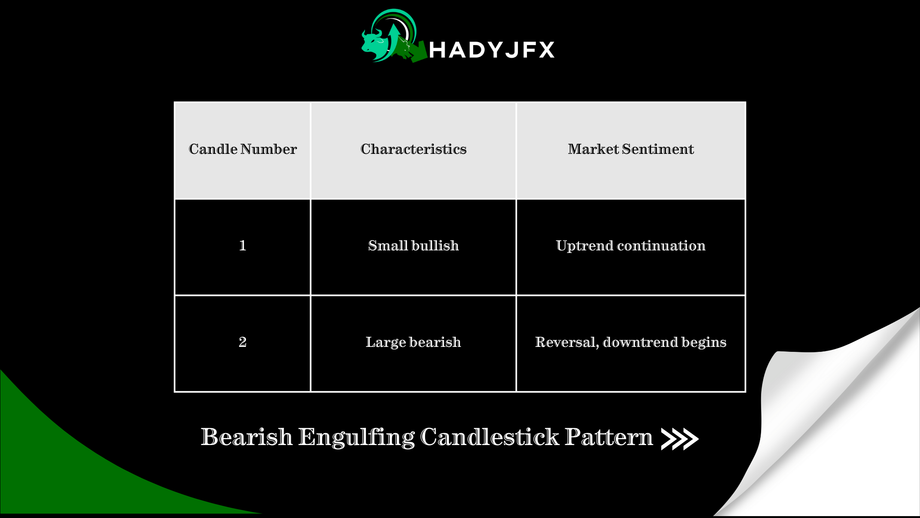
The bearish engulfing pattern is the reverse of the bullish engulfing pattern. It suggests that sellers are beginning to control the market and points to a possible reversal at the end of an upward trend. The bearish engulfing pattern has two candles, just like the bullish one:
Pattern Structure:
- First Candle: A small bullish candle that continues the current uptrend.
- Second Candle: A large bearish candle that opens higher than the previous candle but closes lower, completely engulfing the previous bullish candle.
When a bearish engulfing pattern occurs, it signifies that sellers are gaining control, and buyers may be losing strength. This could indicate a market reversal, providing traders with a signal to consider shorting or selling.
Example Chart:
In the chart below, the bearish engulfing pattern appears at the top of an uptrend, signaling that the trend may be reversing to the downside.
Significance of Bullish and Bearish Engulfing Patterns
The bullish and bearish engulfing patterns are essential for several reasons:
Trend Reversal Signals: These patterns often indicate potential reversals, helping traders anticipate the shift and adjust their positions accordingly.
Market Sentiment Insight: The large body of the engulfing candle suggests a significant change in sentiment, whether it’s from sellers to buyers (bullish) or buyers to sellers (bearish).
Easily Recognizable: These patterns are simple to spot on a chart, making them accessible even to beginners.
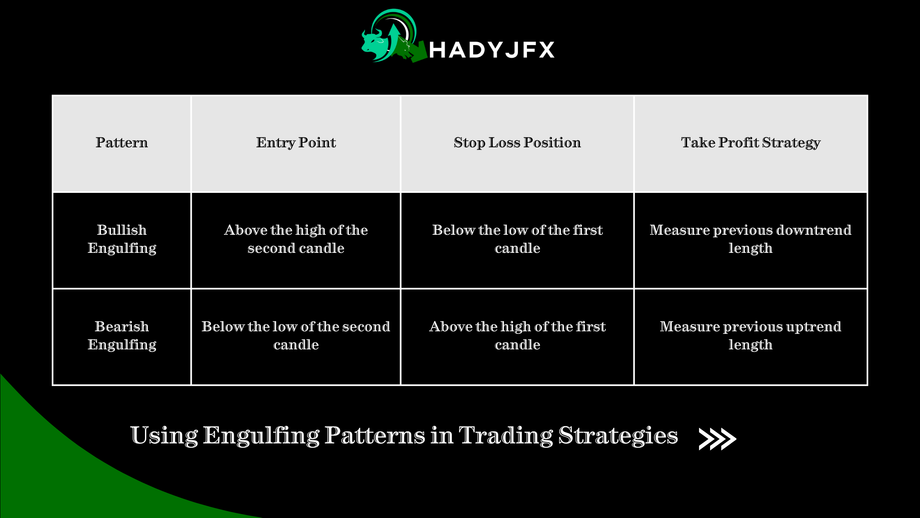
Using Engulfing Patterns in Trading Strategies
Here’s how traders can incorporate engulfing patterns into their strategies:
Trend Confirmation: Always look for bullish engulfing patterns at the bottom of a downtrend and bearish engulfing patterns at the top of an uptrend. They are most effective when they appear after a prolonged trend.
Entry and Exit Points:
Enter a buy trade above the second candle’s high for bullish engulfing.
For bearish engulfing, enter a sell trade below the low of the second candle.
Setting Stop Losses: Place stop-loss orders slightly below the low of the bullish engulfing pattern and slightly above the high of the bearish engulfing pattern to manage risk in case the pattern fails.
Example 1 – Bullish Engulfing:
Suppose a stock or forex pair has been in a steady downtrend. After the appearance of a little bearish candle, it is fully engulfed by a massive bullish candle. This pattern signals that buyers are gaining control, and a potential upward reversal is about to occur. To profit from the trend reversal, a trader can put a buy order above the second candle’s high.
Example 2 – Bearish Engulfing:
Examine a currency pair that is strongly rising and displays a little bullish candle that is engulfed by a larger bearish candle. This bearish engulfing pattern suggests that sellers have taken control, and a trend reversal may be imminent. A short-selling position could be initiated by a trader below the second candle’s low.
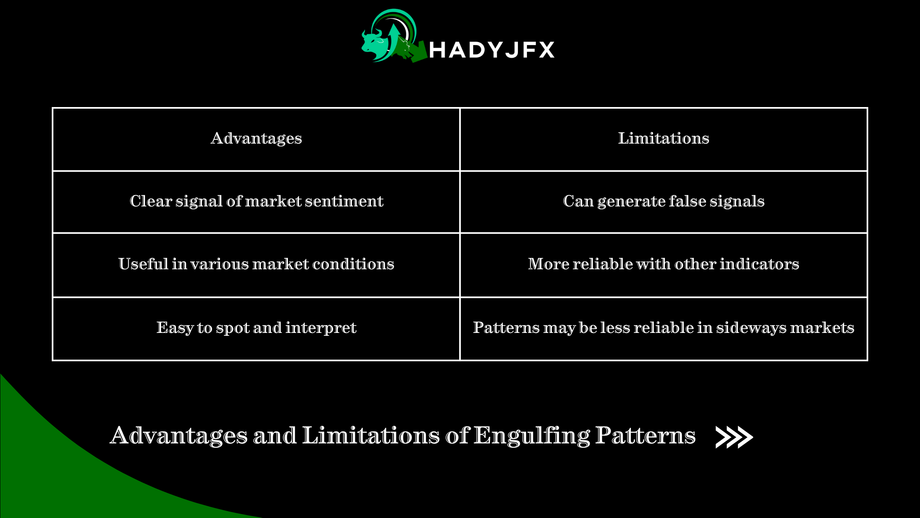
Advantages and Limitations of Engulfing Patterns
While bullish and bearish engulfing patterns are powerful indicators, they are not foolproof. False signals can occur, especially in sideways or choppy markets, and it’s best to use them in conjunction with other technical indicators, such as Moving Averages, RSI, or MACD.
Common Indicators to Confirm Engulfing Patterns
Moving Averages: A crossover of shorter-term moving averages over long-term averages can confirm bullish patterns, while the opposite indicates bearish potential.
Relative Strength Index (RSI): Overbought or oversold levels can provide additional confirmation, with overbought levels supporting bearish engulfing and oversold levels supporting bullish engulfing.
Volume Analysis: When an engulfing pattern forms, a rise in trade volume lends the pattern legitimacy and validates a significant shift in emotion.
Conclusion
Bullish and bearish engulfing patterns offer traders valuable insights into trend reversals, aiding in identifying strategic entry and exit points. Despite being trustworthy indications, these patterns should be combined with other technical indicators and good risk management techniques. By understanding and applying these patterns correctly, traders can enhance their decision-making and potentially improve profitability in their trading journey.
Visit our social media pages:-
https://www.instagram.com/hadyjfx_official/
https://www.youtube.com/@hadyjmentor7793
https://www.facebook.com/profile.php?id=61562232239915
Visit our social media pages:-
https://www.instagram.com/hadyjfx_official/
https://www.youtube.com/@hadyjmentor7793
https://www.facebook.com/profile.php?id=61562232239915
© All Rights Reserved.

