The forex market offers countless opportunities for traders, but success depends on understanding how price moves and how to identify the right entry and exit points. One of the most widely used technical indicators in trading is the Relative Strength Index, commonly known as RSI. This powerful momentum indicator helps traders understand whether a market is overbought or oversold, making it an essential tool for both beginners and experienced traders.
In today’s fast-moving financial markets, traders rely on indicators that simplify decision-making and provide clear signals. The RSI indicator is one such tool that has stood the test of time due to its simplicity and effectiveness. Whether you are just starting your trading journey or already have experience in the market, understanding RSI can significantly improve your trading accuracy and confidence.
What is RSI Indicator?
The Relative Strength Index (RSI) is a technical indicator that evaluates how quickly price is moving and how strong those movements are over time. It was developed by J. Welles Wilder and is used to identify potential reversal points in the market. The RSI moves between 0 and 100, providing traders with insights into market strength and weakness.
When the RSI value rises above a certain level, it indicates that the asset may be overbought. When it falls below a certain level, it suggests that the asset may be oversold. These signals help traders anticipate possible reversals or corrections in price.
The RSI is not just about overbought and oversold conditions. It also helps traders understand market momentum, trend strength, and potential entry and exit points. Because of its versatility, RSI is widely used across forex, stocks, and cryptocurrency markets.
How RSI Works in Forex Trading
To truly understand how the RSI works, it is important to know how it reflects market behavior. The indicator calculates the average gains and losses over a specific period, usually 14 periods. Based on this calculation, it provides a value that shows whether buyers or sellers are dominating the market.
When buyers are stronger, the RSI moves higher. When sellers take control, the RSI moves lower. This continuous movement helps traders visualize market sentiment in real time.
For example, if the RSI is rising, it means bullish momentum is increasing. If it is falling, bearish momentum is strengthening. This makes RSI a powerful tool for identifying shifts in market direction.
Understanding Overbought and Oversold Levels
One of the most important concepts in RSI trading is understanding overbought and oversold conditions. These levels help traders determine when a market might be due for a reversal.
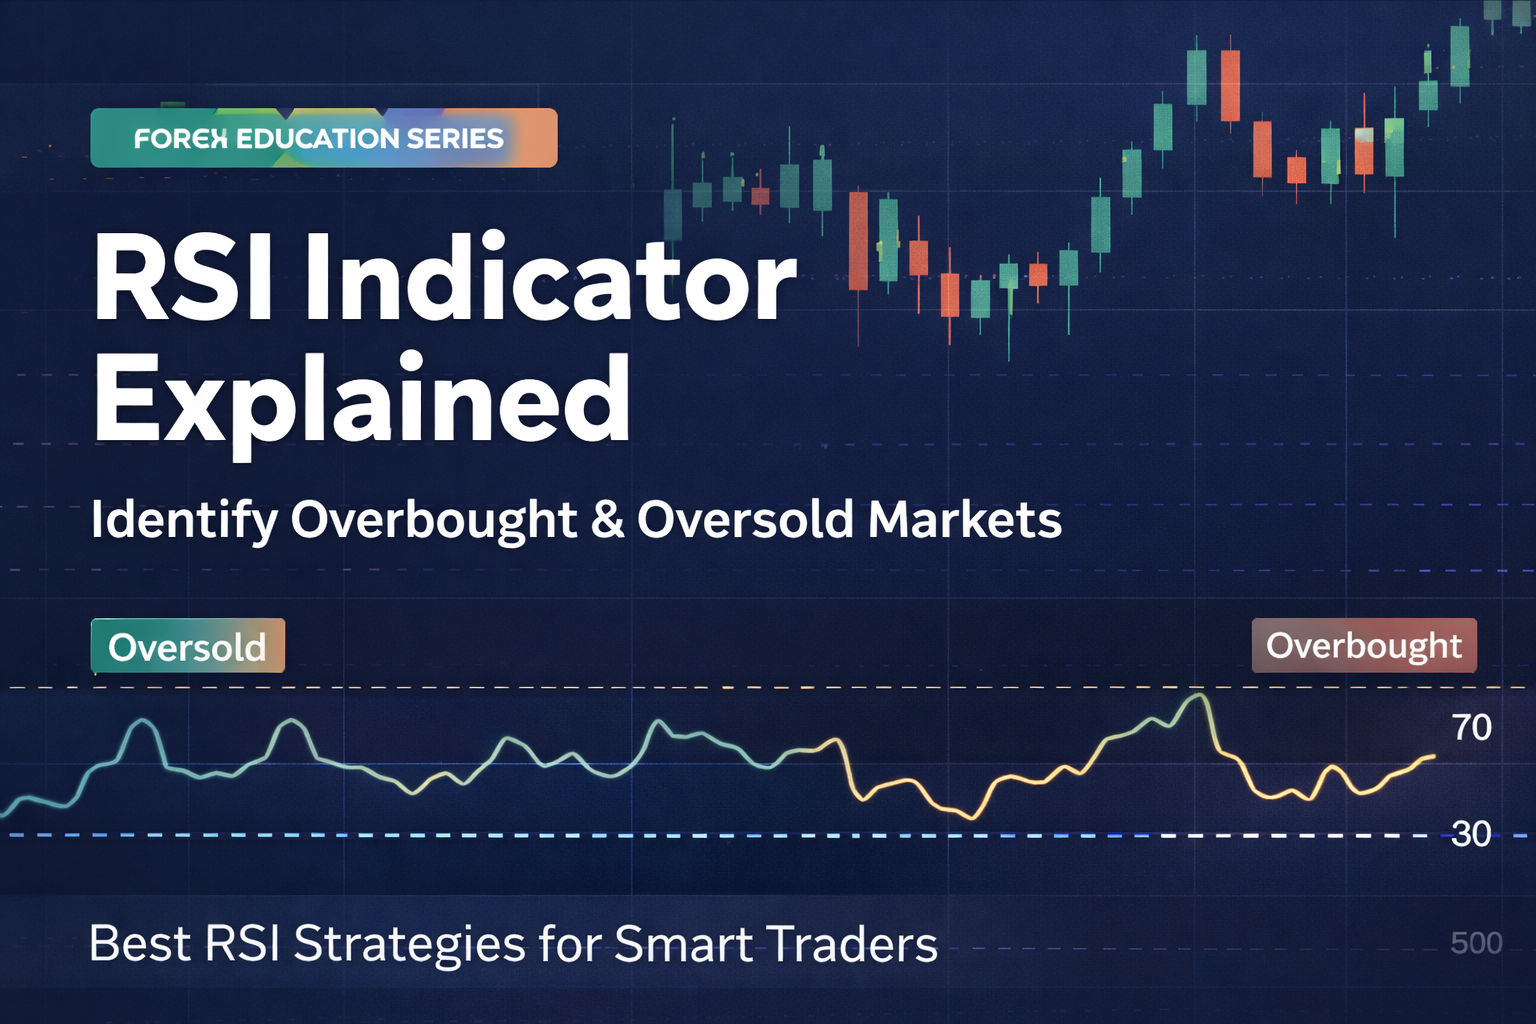
In most cases, when RSI moves above the 70 level, it suggests that the market may be stretched on the upside. This means that the price has increased significantly and may be due for a correction or pullback. On the other hand, an RSI value below 30 is considered oversold, indicating that the price has dropped significantly and may bounce back.
However, it is important to note that overbought does not always mean the price will immediately fall, and oversold does not guarantee an immediate rise. In strong trends, the RSI can remain in these zones for extended periods.
Why RSI is Important for Traders
The RSI indicator is important because it helps traders avoid emotional decisions and rely on data-driven analysis. Many beginners struggle with identifying the right time to enter or exit a trade. RSI simplifies this process by providing clear signals.
It also helps traders confirm trends and identify potential reversals. By combining RSI with other tools, traders can improve their accuracy and reduce unnecessary risks.
Another key advantage of RSI is its adaptability. It works well in different market conditions and can be used across various timeframes. Whether you are a scalper, day trader, or swing trader, RSI can fit into your strategy.
RSI Strategy 1: Overbought and Oversold Reversal Strategy
One of the most popular RSI strategies is the overbought and oversold reversal strategy. This approach focuses on identifying extreme market conditions and trading potential reversals.
When the RSI moves above 70, traders look for selling opportunities, expecting the price to reverse downward.
When the RSI falls below 30, traders look for buying opportunities, anticipating a potential upward movement.
This strategy works best in range-bound markets where prices move between support and resistance levels. Traders often combine RSI with support and resistance to improve accuracy.
RSI Strategy 2: RSI Divergence Strategy
RSI divergence is a powerful technique used by experienced traders to identify potential trend reversals. Divergence happens when price action continues in one direction, but the RSI starts showing movement in the opposite direction, signaling weakening momentum.
For example, if the price is making higher highs but the RSI is making lower highs, it indicates weakening momentum and a possible reversal. Similarly, if the price is making lower lows while RSI is making higher lows, it suggests that the downward momentum is weakening.
This strategy helps traders spot early signs of trend changes before they become obvious in the price chart.
RSI Strategy 3: RSI Trend Confirmation Strategy
RSI can also be used to confirm trends. During an uptrend, RSI usually holds above the 40 level and frequently fluctuates within a higher range, often between 40 and 80. In a downtrend, it usually stays below 60 and moves between 20 and 60.
Traders use this behavior to confirm whether a trend is strong or weakening. If RSI remains in the bullish zone, it confirms an uptrend. If it stays in the bearish zone, it confirms a downtrend.
This strategy is especially useful for trend-following traders who want to trade in the direction of the market.
RSI Strategy 4: RSI 50 Level Strategy
The 50 level in RSI acts as a midpoint that indicates market direction. When RSI is above 50, it suggests bullish momentum. When it is below 50, it indicates bearish momentum.
Traders use this level to confirm entries. For example, if RSI crosses above 50, it can be considered a buy signal. If it crosses below 50, it can be seen as a sell signal.
This strategy is simple yet effective, making it ideal for beginners.
Common Mistakes When Using RSI
Many traders make mistakes when using RSI, especially beginners. One common mistake is relying solely on RSI without considering other factors. While RSI is powerful, it should not be used alone.
Another mistake is trading every overbought or oversold signal. In trending markets, RSI can stay in extreme zones for a long time, leading to false signals.
Traders also ignore risk management, which can result in significant losses. Proper risk management is essential for long-term success.
Combining RSI with Other Indicators
To improve accuracy, traders often combine RSI with other indicators. For example, combining RSI with moving averages can help confirm trends. Using RSI with support and resistance levels can improve entry points.
Some traders also combine RSI with MACD or Bollinger Bands to get stronger signals. This multi-indicator approach reduces false signals and increases confidence in trades.
Best Timeframes for RSI Trading
RSI can be used on different timeframes depending on your trading style. Short-term traders may use lower timeframes like 5-minute or 15-minute charts. Swing traders often prefer 1-hour or 4-hour charts.
Long-term traders may use daily or weekly charts. The key is to choose a timeframe that matches your strategy and trading goals.
Advantages of RSI Indicator
The RSI indicator has several advantages that make it popular among traders. It is easy to understand and use, making it beginner-friendly. It provides clear signals that help traders make informed decisions.
It also works well in different market conditions and can be applied to various assets. Additionally, RSI helps traders identify both reversals and trends, making it a versatile tool.
Limitations of RSI Indicator
Despite its advantages, RSI also has limitations. It can give false signals in strong trending markets. Traders may enter trades too early based on RSI alone.
It also does not provide exact entry and exit points, so it should be used with other tools. Understanding these limitations helps traders use RSI more effectively.
How Beginners Should Start Using RSI
Beginners should start by understanding the basic concept of RSI and practicing on demo accounts. Testing multiple methods and reviewing performance regularly helps traders identify what suits their style most effectively.
They should also focus on risk management and avoid overtrading. Learning to combine RSI with other tools can improve results.
Patience and consistency are key when learning any trading strategy.
Conclusion
The RSI indicator is one of the most powerful and widely used tools in forex trading. It helps traders identify overbought and oversold conditions, understand market momentum, and find potential entry and exit points.
While it is simple to use, mastering RSI requires practice and discipline. By combining RSI with other indicators and following proper risk management, traders can improve their chances of success.
Forex trading is not about quick profits but about consistent growth and learning. The RSI indicator can be a valuable part of your trading journey if used correctly.
Join Our Community
Stay connected and keep learning:
Instagram: https://www.instagram.com/hadyjfx_official
YouTube: https://www.youtube.com/@hadyjmentor7793
Facebook: https://www.facebook.com/profile.php?id=61562232239915
Join our free Telegram channel:
https://t.me/hadyjfx