The forex market is constantly moving, and understanding volatility is one of the most important skills a trader can develop. Many traders focus only on direction, but experienced traders know that volatility plays a key role in identifying high-probability trading opportunities. One of the most powerful indicators used to measure volatility and market behavior is Bollinger Bands.
Bollinger Bands is a widely used technical indicator that helps traders identify breakout opportunities, reversals, and market conditions such as expansion and contraction. Whether you are a beginner trying to understand the basics or an experienced trader looking to refine your strategy, Bollinger Bands can become a valuable part of your trading system.
What Are Bollinger Bands?
Bollinger Bands is a technical indicator developed by John Bollinger. It consists of three lines plotted on a price chart. The middle line is a moving average, usually a 20-period simple moving average, while the upper and lower bands are calculated based on standard deviation.
The upper band represents a level above the moving average, and the lower band represents a level below it. These bands expand and contract based on market volatility. When volatility increases, the bands widen, and when volatility decreases, the bands contract.
This dynamic behavior makes Bollinger Bands unique compared to other indicators. Instead of fixed levels, it adapts to market conditions, helping traders understand when the market is calm and when it is active.
How Bollinger Bands Work
To understand how Bollinger Bands work, it is important to focus on their structure. The middle band acts as a reference line, showing the average price over a certain period. The upper and lower bands act as dynamic support and resistance levels.
When the price moves toward the upper band, it indicates strength and possible overextension. When the price moves toward the lower band, it suggests weakness or potential overselling.
However, it is important to understand that touching the bands does not automatically mean the market will reverse. In strong trends, price can continue moving along the bands for a long time.
Understanding Volatility with Bollinger Bands
Volatility is one of the key concepts in trading, and Bollinger Bands is designed to measure it. When the bands are wide, it means the market is experiencing high volatility. Traders should experiment with different approaches and focus on the methods that consistently deliver better results.
Low volatility periods are often followed by high volatility movements. This is why traders pay close attention to Bollinger Band contraction, also known as the squeeze.
The squeeze indicates that the market is preparing for a breakout. When the bands start expanding after a squeeze, it often signals the beginning of a strong move.
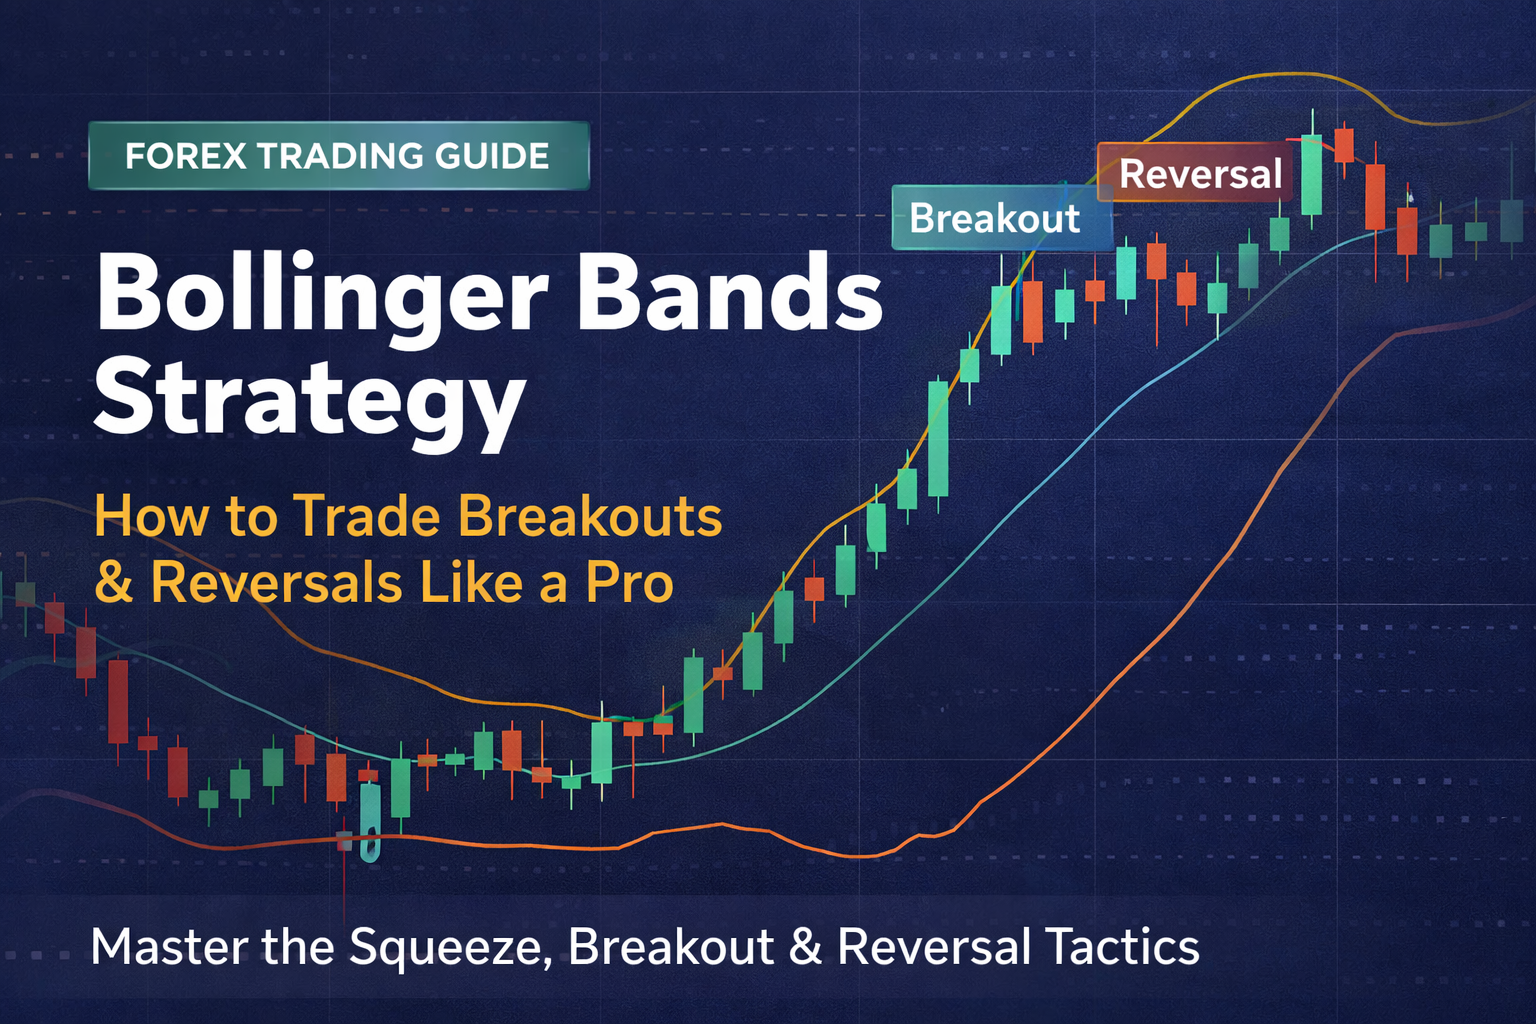
Bollinger Bands Breakout Strategy
One of the most popular strategies using Bollinger Bands is the breakout strategy. This strategy focuses on identifying moments when the market moves from low volatility to high volatility.
When the bands contract tightly, it signals that the market is in a consolidation phase. Traders wait for the price to break above the upper band or below the lower band.
A breakout above the upper band indicates potential bullish momentum, while a breakout below the lower band suggests bearish momentum.
However, traders should not rely solely on the breakout. Confirmation from volume, price action, or other indicators can improve accuracy.
Bollinger Bands Reversal Strategy
Another powerful use of Bollinger Bands is identifying reversals. When the price touches or moves outside the bands, it may indicate that the market is overextended.
In such cases, traders look for signs of reversal. For example, if the price touches the upper band and shows rejection, it may move downward. Similarly, if the price touches the lower band and shows support, it may move upward.
This strategy works best in range-bound markets where price moves between support and resistance levels.
The Bollinger Band Squeeze Strategy
The squeeze strategy is one of the most effective ways to trade Bollinger Bands. It focuses on identifying periods of low volatility before a major breakout.
When the bands become very narrow, it indicates that the market is quiet. This is often followed by a sudden increase in volatility.
Traders wait for the breakout direction and enter trades accordingly. The key to this strategy is patience, as traders must wait for the right setup.
Using Bollinger Bands with Trend Trading
Bollinger Bands can also be used in trending markets. In a strong uptrend, the price tends to stay near the upper band. In a downtrend, the price stays near the lower band.
Traders can use this behavior to trade with the trend instead of against it. For example, in an uptrend, buying near the middle band can be a good opportunity.
Understanding trend behavior helps traders avoid false signals and improves trade selection.
Combining Bollinger Bands with Other Indicators
While Bollinger Bands is powerful on its own, combining it with other indicators can improve results. For example, combining it with RSI can help identify overbought and oversold conditions more accurately.
Using moving averages can help confirm trend direction, while MACD can provide momentum confirmation.
This multi-indicator approach reduces false signals and increases confidence in trades.
Common Mistakes When Using Bollinger Bands
Many traders make mistakes when using Bollinger Bands. One common mistake is assuming that price touching the bands means immediate reversal.
Another mistake is trading breakouts without confirmation. False breakouts are common, especially in low-volume markets.
Traders also ignore market conditions, using the same strategy in both trending and ranging markets.
Understanding these mistakes helps traders improve their performance.
Best Timeframes for Bollinger Bands
Bollinger Bands can be used on different timeframes depending on your trading style. Scalpers may use lower timeframes such as 5-minute or 15-minute charts.
Swing traders often prefer 1-hour or 4-hour charts, while long-term traders use daily charts.
As market volatility rises, the distance between the bands expands, while lower volatility causes the bands to tighten.
Advantages of Bollinger Bands
Bollinger Bands offers several advantages. It adapts to market volatility, making it dynamic and flexible.
It helps identify breakouts, reversals, and trends. It is also easy to understand, making it suitable for beginners.
Because of its versatility, it is widely used across different financial markets.
Limitations of Bollinger Bands
Despite its advantages, Bollinger Bands has limitations. It does not provide exact entry or exit points.
It can also give false signals during strong trends or low-volume conditions.
Traders should use it in combination with other tools for better accuracy.
How Beginners Should Use Bollinger Bands
Beginners should start by understanding the basic structure of Bollinger Bands. Practicing on demo accounts is highly recommended.
They should focus on simple strategies such as breakout and reversal before moving to advanced techniques.
Consistency and discipline are key to success.
Trading Psychology and Discipline
Emotional control is essential in trading. Fear and greed can lead to poor decisions.
Traders should follow their strategy and avoid impulsive trades. Discipline helps maintain consistency and improve long-term results.
Conclusion
Bollinger Bands is a powerful indicator that helps traders understand market volatility and identify high-probability trading opportunities. It can be used for breakout trading, reversal trading, and trend confirmation.
While it is simple to use, mastering it requires practice and discipline. By combining Bollinger Bands with other indicators and applying proper risk management, traders can significantly improve their trading performance.
Forex trading is a long-term journey, and tools like Bollinger Bands can help traders navigate the market more effectively.
Join Our Community
Instagram: https://www.instagram.com/hadyjfx_official
YouTube: https://www.youtube.com/@hadyjmentor7793
Facebook: https://www.facebook.com/profile.php?id=61562232239915
Join Telegram: https://t.me/hadyjfx