How to Build a Profitable Forex Trading Strategy from Scratch (Complete Guide)
A Complete Step-by-Step Guide for Traders Building a profitable forex trading strategy is one of the most important steps in becoming a consistently successful trader. Many traders jump from strategy to strategy, hoping to find a “holy grail.” In reality, profitable trading comes from developing a structured system, testing it, and executing it with discipline. This guide explains exactly how to build your own trading strategy from zero. It covers market structure, entry and exit rules, indicator selection, backtesting, optimization, and final execution. By the end of this guide, you will understand how professional traders create strategies that work across market conditions and deliver stable performance. 1. Understanding Market Structure: The Foundation of Every Strategy Market structure forms the backbone of any strong trading strategy. Before using indicators or advanced tools, traders must understand the natural movement of price. What is Market Structure? Market structure shows how price moves in trends and ranges. It includes swings, breakouts, and retracements. Market structure tells you whether buyers or sellers are in control. Key Components of Market Structure Uptrend: Higher highs and higher lows.Buying opportunities appear at retracements. Downtrend: Lower lows and lower highs.Selling opportunities appear at pullbacks. Range or Consolidation: Price moves sideways within a defined zone.Trading is slower and often choppy. Why Market Structure Matters Helps identify trend direction Avoids trading against momentum Improves trade accuracy Prevents emotional entries Acts as the base for entry and exit rules A profitable strategy always aligns with market structure, not against it. 2. Defining Your Trading Style Before Building the Strategy Not every strategy suits every trader. Your strategy should match your lifestyle, time availability, and mindset. Common Trading Styles Scalping: Fast trading, small profits, requires focus and quick decisions. Day Trading: Trading within a single session, no overnight positions. Swing Trading: Holding trades for days, uses higher time frames. Position Trading: Long-term trades based on fundamentals and trends. Choose Your Style by Asking These Questions How much time can you spend on charts daily? Do you prefer fast or slow trading? Are you patient or aggressive? Can you remain calm when holding trades overnight? Once your trading style is clear, building your strategy becomes much easier. 3. Setting Up Entry Rules: How to Take High-Quality Trades A profitable strategy has crystal-clear entry rules. These rules reduce emotional decisions and increase consistency. Components of High-Probability Entry Rules Trend Direction: Trade only in the direction of the higher-time-frame trend. Key Levels: Identify support, resistance, supply, and demand zones. Confirmation Signal: Wait for a specific pattern or indicator signal. Timing: Entry should align with market session volatility. Common Entry Techniques Breakout Trading: Enter when price breaks above resistance or below support. Retest Trading: Wait for price to break a level and retest it before entering. Reversal Pattern Trading: Use double tops, double bottoms, pin bars, or engulfing candles. Momentum Trading: Enter when price accelerates in the direction of the trend. Example of a Clear Entry Rule Price must be above the 50 EMA. Market must make a higher low. Bullish engulfing candle must appear near a support zone. Clear rules = consistent results. 4. Setting Up Exit Rules: When to Take Profit and When to Close the Trade Many traders know how to enter trades but don’t know when to exit. Exit rules are equally important for long-term profitability. Types of Exit Strategies Fixed Risk-to-Reward Exit: For example, taking profit at 1:2 or 1:3. Trailing Stop Exit: Move stop loss in profit as the market moves. Structure-Based Exit: Exit at previous highs/lows or major supply-demand zones. Indicator-Based Exit: Exit when indicators show exhaustion or reversal. Stop Loss Placement Good stop loss placement uses: Market structure Volatility (ATR) Swing highs or lows A stop loss protects your account and preserves emotional discipline. 5. Choosing Indicators That Support Your Strategy Indicators should support your decision-making, not confuse you. Use a maximum of two or three indicators. Best Indicators for Forex Strategy Building Moving Averages: Helps identify trend direction and dynamic support/resistance. RSI (Relative Strength Index): Shows overbought or oversold conditions, helps detect reversals. MACD: Shows momentum and trend changes. ATR (Average True Range): Helps calculate stop loss based on market volatility. How to Use Indicators Properly Indicators should confirm market structure, not replace it. Avoid using too many indicators together. Choose indicators that match your trading style. Simple indicators + strong price action = powerful strategy. 6. Creating Your Complete Trading Strategy Template Here is a clean structure for your strategy: Trading Strategy Template 1. Market Environment Identify trend on higher time frame Mark support and resistance levels Define bias (buy or sell only) 2. Entry Conditions Trend direction confirmed Pullback or breakout aligns with bias Indicator confirmation Clean price action signal 3. Exit Conditions Defined stop-loss Profit target based on risk-reward Optional trailing stop 4. Risk Management Rules Fixed percentage risk per trade Maximum trades per day Daily and weekly loss limits 5. Trading Session Rules Trade only during specific sessions Avoid major high-impact news 6. Journaling and Review Process Screenshot each trade Record emotional state Identify improvements A complete strategy gives you clarity and removes doubt during live trading. 7. Backtesting: The Key to Confidence and Consistency Before trading with real money or in a prop firm challenge, backtest your strategy properly. Backtesting shows whether your idea has statistical profitability. How to Backtest Your Strategy Select a pair and time frame. Scroll back at least one to three years. Mark every valid entry based on your rules. Track your results in a spreadsheet. Calculate win rate, drawdown, and expectancy. What Backtesting Reveals Whether your strategy is profitable Maximum losing streak Strength of entry rules Areas of improvement Backtesting builds confidence and stops emotional trading. 8. Optimization: Improving Your Strategy Without Overfitting Optimization helps refine your strategy, but it should not make it unrealistic. Optimization Tips Keep rules simple Adjust stop loss or take profit levels Test different session timings Analyse which
How to Become Successful in Prop Trading Firms?
How To Become Successful In Prop Trading Firms? A Complete Step-By-Step Guide for Traders** Prop trading has become a powerful opportunity for traders who want to grow their capital without risking large personal funds. With funded accounts, scaling plans, and consistent payouts, proprietary trading firms are now the preferred career path for disciplined traders worldwide. But the biggest question remains: How can a trader become consistently successful in a prop trading firm? This complete guide explains every major step, from building a reliable strategy to managing risk, improving psychology, and maintaining funded status with long-term consistency. 1. Understanding Prop Trading and What Prop Firms Expect A prop trading firm gives traders access to its capital and shares the profits generated. In exchange, traders must follow rules, manage risk responsibly, and demonstrate consistency. Prop firms mainly expect two things: Protect the Firm’s Capital Your first responsibility is to avoid unnecessary losses. Traders who trade aggressively or emotionally usually fail challenges quickly. A trader who protects capital automatically increases their chance of long-term profitability. Show Consistency and Rule-Based Trading Prop firms look for traders who think professionally, follow risk guidelines, avoid gambling behaviour, and maintain a stable equity curve. Consistency is valued more than sudden high returns. 2. Risk Management: The Foundation of Success in Prop Trading Strong risk management is the most important skill that separates funded traders from losing traders. Prop firms are designed to reward traders who control risk above all else. Key principles of proper risk management include: Risk Only One Percent or Less Per Trade Large position sizes can destroy an account quickly. Keeping risk between half a percent and one percent per trade maintains emotional control and trading discipline. Respect Daily Drawdown Limits If the prop firm allows a five percent daily drawdown, your personal limit should be around two to three percent. Stopping trading after reaching this level protects your account and prevents emotional decisions. Use a Defined Position Size Formula Use a standard formula to calculate your lot size based on risk percentage and stop loss distance. This removes guesswork and keeps risk consistent across all trades. Create Your Own Maximum Loss Rule Even if the prop firm allows a ten percent total drawdown, professional traders create their own limit well below it. This extra safety layer reduces stress and maintains consistent performance. 3. Develop a Clear and Repeatable Trading Strategy A successful prop trader does not rely on luck or random trades. They follow a system built through experience, testing, and refinement. Your trading strategy must contain: Entry Rules These rules define the exact conditions that qualify as a trade. Clear entry rules may include: Market trend direction Breakout, pullback, or retest conditions Confirmation signals such as market structure shifts or indicator alignment Exit Rules You must know when to close a trade in profit and in loss. Exit rules may include: Fixed risk-to-reward ratio Trailing stop method Exit based on opposite market signals Market Conditions Every strategy performs best in specific environments. Clearly define whether your system works in trending markets, ranges, or low-volatility conditions. Avoid trading when the market environment does not match your strategy. 4. Backtesting and Journaling: Building Confidence Through Data Successful prop traders rely on data, not emotions. Backtesting and journaling provide insights that help you refine your performance and build confidence in your system. Backtest Your Strategy Properly Test your trading strategy on at least one to three years of historical data. Track key factors such as: Average win rate Risk-to-reward ratio Maximum drawdown Losing streak patterns A strategy backed by data gives you the courage to stay consistent even during difficult market phases. Maintain a Detailed Trading Journal A journal should include: Trade entry and exit details Market conditions Emotions before, during, and after each trade Mistakes and improvements Reviewing your journal reveals patterns and helps you eliminate weaknesses over time. 5. Trading Psychology: The Hidden Edge in Prop Trading Most traders fail not because they don’t know strategy but because they cannot control their emotions. Prop trading requires a calm, focused, and disciplined mindset. Key psychological skills include: Patience Professional traders know that waiting for the right setup is more important than being active. No setup simply means no trade. Discipline Following your plan even when tempted to break rules separates successful traders from inconsistent ones. Emotional Control Avoid trading under emotional stress. Fear, greed, anger, overconfidence, and frustration damage your decision-making ability. Confidence Built from Evidence Confidence should come from backtesting, experience, and journaling — not from random wins. 6. The Ideal Daily Routine for a Prop Trader A structured routine keeps your mind clear and your decision-making consistent. Before Trading Review the economic calendar Analyse higher-time-frame market structure Mark important support and resistance zones Establish a directional bias Review your previous day’s journal notes During Trading Wait for trades that match your plan Manage risk according to rules Avoid overtrading and revenge trading Stop trading after hitting your daily limit After Trading Log all trades in your journal Take chart screenshots Identify mistakes and key lessons Prepare levels and bias for the next day A routine eliminates randomness and brings discipline into your trading process. 7. Choosing the Right Prop Firm Different prop firms offer different rules, evaluation types, and payout systems. Choosing the right one increases your chances of long-term success. Important factors to consider: Trading Rules Look for clarity, fairness, and realistic drawdown limits. Credibility and Reviews Research payout proof, trader experiences, and trust ratings. Trading Conditions Spreads, commissions, and execution speed greatly impact profitability. Support and Scaling Programs A reliable support team and transparent scaling structure make a big difference in your long-term journey. 8. Step-By-Step Method to Pass Prop Firm Challenges Follow these steps to pass challenges with consistency: Trade one or two familiar instruments. Risk a maximum of one percent per trade. Aim for modest weekly gains instead of large single wins. Avoid major news events unless your plan is designed for them. Stop trading after achieving
A Comprehensive Guide to Choosing the Right Partner Prop firms
Proprietary trading firms, also known as prop firms, have gained immense popularity among traders seeking access to substantial capital without risking their personal funds. These firms bridge the gap between aspiring traders and the financial markets by providing opportunities to trade larger accounts. Traders exchange a percentage of their gains in exchange. However, with numerous prop firms offering different models and terms, selecting the right one can be challenging. In order to assist traders in making wise choices, this article offers a thorough comparison of prop businesses. Understanding Proprietary Trading Firms Financial organisations known as prop companies use their own funds to support traders. In return, they accept a share of the profits. Unlike traditional brokers, prop firms are focused on funding skilled traders rather than facilitating trades for individual accounts. The unique value proposition of prop firms lies in their ability to mitigate personal financial risk while giving traders access to larger accounts. However, not all firms are created equal, and their policies, structures, and benefits vary significantly. Key Features to Compare in Prop Trading Firms 1. Capital Access One of the most important things to take into account is the different funding amounts offered by prop firms. 2. Evaluation Programs Before allowing traders access to funded accounts, the majority of prop firms demand them to successfully complete an evaluation process. For those who prefer to bypass evaluations, instant funding options are available, though these may come with higher fees or stricter terms. 3. Profit Splits Profit-sharing models determine how much of the earnings traders can retain. 4. Platforms and Instruments The instruments and trading platform that are offered might have a big impact on your approach and experience. 5. Fees and Refund Policies Evaluation and account activation fees are standard across prop firms, but their structures vary. 6. Risk Management Rules Risk management rules protect the firm’s capital and ensure disciplined trading practices. 7. Support and Educational Resources Good customer support and additional resources can enhance the trading experience. Advantages of Prop Trading Firms Disadvantages to Consider How to Choose the Right Prop Firm Take into account the following to determine the ideal fit: Example Scenarios: Choosing a Prop Firm Tips for Succeeding with Prop Firms Conclusion Proprietary trading firms offer exciting opportunities for traders to grow their skills, trade larger accounts, and maximize their earnings. However, success in prop trading requires careful selection of the right firm and adherence to disciplined trading practices. By comparing features like capital access, profit splits, risk management rules, and fees, traders can find a prop firm that aligns with their goals. Take your time to research and choose wisely—your journey with a prop trading firm could be the key to unlocking your potential in the financial markets. If you are confused about which prop firm is best for you, we will guide you for free. For more information:-https://www.instagram.com/hadyjfx_officialhttps://www.youtube.com/@hadyjmentor7793https://www.facebook.com/profile.php?id=61562232239915
What is a Prop Firm in the Financial Market?
A Proprietary Trading Firm (commonly called a prop firm) is a financial institution or company that uses its own money to trade in various markets such as forex, stocks, cryptocurrencies, or commodities. Unlike hedge funds or asset managers, prop firms do not manage external funds but instead focus entirely on generating profits using internal capital. Prop firms employ skilled traders, providing them with access to significant capital and a share of the profits they generate. Both the company and the trader gain from this arrangement. The firm earns from the trader’s success, while traders gain access to larger funds than they could personally afford. How Prop Firms Operate 1. Providing Trading Capital Prop firms allow traders to use their money for trading. A trader who proves their skills through evaluations or past records can be allocated funds, often starting from $10,000 to over $1,000,000. 2. Profit Sharing The trader earns a percentage of the profits generated, usually between 50% and 90%, depending on the firm’s policy. For example: If a trader makes $5,000 in a month and has an 80% profit-sharing agreement, they take home $4,000 while the firm retains $1,000. 3. Risk Management Rules To protect their funds, prop firms enforce strict rules: Daily Loss Limit: The most amount of money that can be lost in a single day. Maximum Drawdown: The largest overall loss allowed from the initial capital. Risk-to-Reward Guidelines: Mandating minimum reward ratios for trades. 4. Evaluating Traders Most firms have an entry process where traders prove their skills through challenges or simulations. Common requirements include: reaching a certain profit goal, such as 10% of the account. Maintaining strict drawdown limits (e.g., less than 5%). Advantages of Working with a Prop Firm 1. Access to Large Capital Prop firms allow traders to execute large trades, significantly increasing their potential profits without risking personal savings. 2. No Personal Financial Risk Since traders use the firm’s capital, their financial exposure is minimized. Traders lose only their chance to trade further with the firm if they fail. 3. Professional Growth Many prop firms offer: Training and mentorship. Access to professional trading tools and platforms. Guidance from experienced traders. 4. High Earning Potential With access to large funds and a profit-sharing model, skilled traders can earn substantial amounts even with modest account growth. 5. Supportive Environment Traders gain from collaboration opportunities, access to analytics, and advanced trading software. Challenges of Prop Firms 1. Evaluation Pressure Passing evaluations or challenges can be difficult. Many firms impose strict profit and risk criteria. 2. Strict Rules Prop businesses frequently impose strict limitations, like: Maximum allowable loss in a day. Mandatory stop-loss usage. Restrictions on trading specific assets or times. 3. Profit Splits Although traders earn significant profits, they must share a portion with the firm. For example, an 80/20 split leaves 20% of earnings with the company. 4. Account Termination Failing to meet the firm’s requirements, such as exceeding a loss limit, results in losing the account. 5. Market Volatility Risks Although prop firms mitigate financial risks for traders, market volatility can still lead to emotional challenges like stress and decision fatigue. Types of Prop Firms 1. Remote Prop Firms These firms allow traders to work online from anywhere. Examples include: FTMO: Specializes in forex and CFD trading. MyForexFunds: Caters to traders of all levels, offering multiple funding options. 2. Office-Based Prop Firms Traditional firms with physical offices where traders work collaboratively. They provide: Direct mentorship. In-house technology and market analysis teams. A competitive trading floor environment. 3. Hybrid Models Combine remote flexibility with office resources. Traders can choose their preferred work setup. Popular Prop Firms FTMO Two-step evaluation process. Focus on forex and CFDs. Profit-sharing up to 90%. MyForexFunds Offers evaluation and accelerated funding programs. Beginner-friendly policies. 5%ers Provides funding without time pressure. Encourages consistent growth. TopStepTrader Specializes in futures trading. Straightforward funding process. How to Choose the Right Prop Firm The following should be considered when selecting a prop company: 1. Evaluation Criteria Make sure your trading approach fits the firm’s challenges. For example, scalpers need firms with flexible time limits. 2. Profit-Sharing Percentage Higher profit splits mean better earnings for traders. Choose a firm offering competitive shares like 80/20 or 90/10. 3. Risk Policies Understand the firm’s drawdown rules, loss limits, and other restrictions before signing up. 4. Additional Resources Look for firms offering: Training programs. Proprietary software. Mentorship. 5. Reputation Research reviews, trader feedback, and the firm’s track record to ensure reliability. Why Are Prop Firms Popular? Prop firms have gained popularity because they empower individuals to enter financial markets without requiring large personal investments. They democratize trading by focusing on skill and consistency rather than wealth. With the right skills and discipline, traders can achieve financial independence and professional success through prop firms. Conclusion Prop firms are transforming the financial landscape by offering traders access to capital, professional resources, and collaborative environments. While the journey requires skill, discipline, and adherence to strict guidelines, the potential rewards are immense. For traders seeking to elevate their careers without risking their own money, prop firms present an excellent opportunity. By joining a reputable prop firm, aspiring traders can turn their passion for trading into a lucrative and sustainable profession. Let’s explore the financial markets with the right partner!
Suraksha Diagnostic IPO: Everything You Need to Know

The Suraksha Diagnostic IPO subscription period is set to begin on November 29, 2024, and end on December 3, 2024. Raise money to help Suraksha Diagnostic, one of India’s leading diagnostic service providers, build its business and increase its market share in the rapidly expanding healthcare industry. To determine if an initial public offering is worth your investment, let’s examine the specifics. IPO Details Date of Bidding the IPO: November 29, 2024, through December 3, 2024 Price Band: ₹420 to ₹441 per share Lot Size: 34 shares Minimum Investment: ₹14,280 (for one lot) Issue Size: ₹846.25 Crores About Suraksha Diagnostic A major participant in India’s healthcare diagnostics market, Suraksha Diagnostic Ltd. provides radiology, pathology, and preventative health examination services. Now that it has established a strong diagnostic centre network in key cities, the company is concentrating on growing into Tier-2 and Tier-3 cities. Objectives of the IPO The following uses will be made of the money acquired through the IPO: establishing additional Diagnostic Centres in new areas. putting money into technology to improve operational effectiveness and service quality. Debt repayment lowers interest expenses and increases financial stability. providing the working capital required to keep things running on a daily basis. Financial Performance In recent years, Suraksha Diagnostic has seen remarkable financial progress. Compared to FY 2023, the company’s sales increased by 14.75%, while its net profit increased by a noteworthy 281.32% in FY 2024. This strong recovery and profit growth highlight the company’s resilience and strategic focus on expansion and operational efficiency. Strengths of Suraksha Diagnostic Strong Financial Growth: Significant revenue and profit growth in FY 2024. Established Brand: A well-recognized name in healthcare diagnostics. Expanding Network: Plans to enter underserved Tier-2 and Tier-3 cities. Focus on Technology: Continuous investment in advanced diagnostic equipment. Growing Demand: Rising healthcare awareness and the need for preventive healthcare services. Potential Risks Despite its strengths, investors should consider the following risks: Revenue Volatility: Despite a strong FY 2024, the company saw a dip in revenue in FY 2023. High Level of Competition: There is fierce competition in the healthcare diagnostics industry. Operational Costs: Rising costs of medical equipment and skilled personnel may impact profit margins. Regulatory Challenges: Changes in healthcare regulations could affect operations. Should You Invest? The Suraksha Diagnostic IPO offers a promising investment opportunity for those looking to capitalize on the growing healthcare diagnostics industry. The company’s impressive profit growth and expansion plans make it an attractive option for long-term investors. Pros: Revenue and earnings increased significantly in FY 2024 Expanding presence in new marketsFocus on technological advancements to improve service quality Cons:Revenue fluctuations in previous yearsHigh competition and operational challenges Key Dates to Remember IPO Opens: 29th November 2024 IPO Closes: 3rd December 2024 Allotment Date: 6th December 2024 Listing Date: 11th December 2024 Conclusion An attractive option for investors looking to gain exposure to the healthcare diagnostics industry is the Suraksha Diagnostic IPO. The business is well-positioned for future success thanks to its robust financial growth, strategic development, and technological focus. However, investors should carefully assess their risk appetite and investment goals before making a decision. If you are a long-term investor looking for growth potential in the healthcare sector, Suraksha Diagnostic IPO could be a valuable addition to your portfolio. Visit our Social media pages:https://www.instagram.com/hadyjfx_official/https://www.youtube.com/@hadyjmentor7793https://www.facebook.com/profile.php?id=61562232239915
Prior to the US inflation measure, major currencies consolidate as the market reorganises.

As investors continued to assess President-elect Donald Trump’s tariff promises and watched a significant inflation statistic released by the United States later in the day, the U.S. On Wednesday, the dollar remained stable in relation to its major peers. After the Reserve Bank of New Zealand lowered benchmark rates by 50 basis points to 4.25% and reported that inflation had decreased to about the middle of its projected range, The currency of New Zealand gained value. However, part of the response was subdued later in the U.S. day, Trump’s Monday pledges of high tariffs on the US’s top three trading partners—China, Canada, and Mexico—remain unsettling to investors. The resurgence of uncertainty surrounding U.S. policymaking under a second Trump administration is likely to keep markets on edge, according to Carol Kong, currency strategist at Commonwealth Bank of Australia. The USD may benefit from markets selling early and asking questions later as a result of this uncertainty. The dollar dropped down from Tuesday’s 4-1/2-year high of C$1.4178 and was last barely changed against its Canadian counterpart at C$1.4052. After reaching its highest level since July 2022 in the previous session, the dollar stayed below Tuesday’s top vs the Mexican peso. On Tuesday, the U.S. dollar also hit its highest level since July 30 in relation to the Chinese yuan. U.S. President Joe Biden announced on Tuesday that Israel and Iran-backed Hezbollah had agreed to a ceasefire that will go into effect on Wednesday. France and the United States brokered the agreement. Tuesday was the third-highest day for the Israeli shekel. Amid the chaos, the yen managed to hold onto gains from safe-haven buying. The dollar hit a two-week low of 152.81 yen, down 0.19%. Trump’s late Friday appointment of hedge fund manager Scott Bessent to the position of U.S. Treasury secretary caused some instability in the dollar, which then rose following Trump’s tariff pledges. At 106.83, the dollar index, which compares the US dollar to six competitors, was down 0.07% last time. This week’s primary scheduled news item is the October Personal Consumption Expenditures (PCE) price index. Later on Wednesday, it is anticipated to be made available. Many officials agreed that it was prudent to gradually decrease policy constraint, according to the Fed’s November meeting minutes, which were released on Tuesday. Sterling last traded at $1.25735, up 0.05%, while the euro remained relatively stable at $1.0493. Following domestic consumer price inflation remaining at a three-year low in October, the Australian dollar was essentially steady at $0.64755. The price of bitcoin was $91,795, far down than its peak of $99,830 the week before. Bitcoin has struggled to surpass the symbolic $100,000 mark as profit-taking has taken hold. Since the U.S. election, it has increased by over 40% due to predictions that Trump will relax regulations pertaining to cryptocurrencies. Visit our Social media pages:https://www.instagram.com/hadyjfx_official/https://www.youtube.com/@hadyjmentor7793https://www.facebook.com/profile.php?id=61562232239915
What Is Leverage in Forex Trading ?
Leverage in forex trading allows traders to control a larger position in the market with a relatively small amount of their own capital. It is essentially borrowed capital from the broker, enabling traders to amplify their potential profits (or losses) by controlling a higher trade value than their initial investment. For example, if a broker offers 100:1 leverage, it means that for every $1 of your own money, you can control $100 in the market. At 100:1 leverage, $1,000 can be used to purchase ownership of a $100,000 stake. Key Concepts of Leverage: Amplifies Gains and Losses:Profit and loss potential are both increased by leverage. If the market moves in your favor, leverage can lead to significant profits. However, if the market moves against you, losses can be just as large. Margin Requirement:To use leverage, traders must maintain a certain amount of money in their account, called the margin. The leveraged trade uses this margin as collateral. Example of Leverage: Assume your trading account balance is $1,000. You use 100:1 leverage, meaning you can trade up to $100,000 worth of currency. A 1% movement in the market in your favor would net you $1,000, or a 100% return on your initial investment. On the other hand, if the market swings 1% against you, you might lose $1,000, wiping out your entire balance. Benefits of Leverage: Maximizes Trading Opportunities:Traders with smaller capital can still trade larger positions, increasing their potential for profit. More Market Exposure:Leverage enables traders to participate in larger trades, gaining exposure to a wider range of market movements. Risks of Leverage: Raises Risk:Leverage can make gains appear larger, but it can also make losses appear larger. If the market moves against a trader, they could lose more than their initial investment. Margin Calls:If a trade moves against a trader significantly, the broker may issue a margin call, requiring the trader to deposit additional funds to maintain the position. Failure to do so could result in the broker closing the position at a loss. Key Takeaways: With higher leverage, even a small price movement can result in a significant profit or loss. In the second and third examples, the same pip movement (+50 pips or -50 pips) results in a $500 gain or loss because of 100:1 leverage. The last two rows illustrate that increased leverage (100:1) can lead to bigger losses or gains compared to 50:1 leverage, even with the same price movement.
What is RSI Indicator in Forex Trading ?
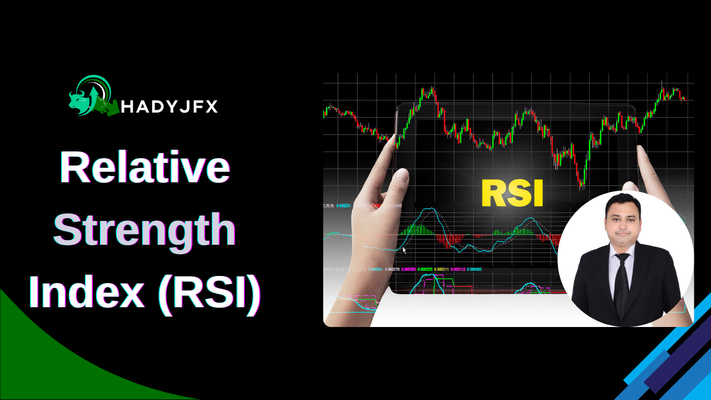
The Relative Strength Index (RSI) is a momentum-based indicator used to evaluate the rate and magnitude of price fluctuations in the forex market. Developed by J. Welles Wilder, the RSI is one of the most widely used technical indicators in trading. It helps traders identify potential overbought or oversold conditions and possible reversal points in the market. How RSI Works The range of RSI values is 0 to 100; values over 70 signify an overbought state, while values below 30 indicate an oversold one. The indicator is typically used over a 14-period timeframe, but traders can adjust it to suit their preferences. The RSI oscillates between these two extremes, providing insights into the strength of the current price trend. Overbought Condition: When the RSI exceeds 70, it indicates that the market is likely overbought, meaning the asset’s price may be inflated and a correction or reversal could be imminent. Oversold Condition: When the RSI falls below 30, it indicates that the market is potentially oversold, and a price bounce or reversal might be expected. RSI Formula RSI is calculated using the following formula: Where: Calculating RS is as follows: RS = Average of Gains over ‘x’ Days / Average of Losses over ‘x’ Days. The RSI provides a normalized value that can be interpreted as the strength of a trend relative to its recent price changes. How to Use RSI in Forex Trading Identifying Overbought and Oversold Levels: Traders use RSI to identify potential reversal points. An overbought RSI indicates the market is overheated and may reverse downward, while an oversold RSI suggests the market is undervalued and may reverse upward. Divergence: RSI divergence happens when the price and RSI move in opposite directions. A possible upward reversal is indicated by bullish divergence, which occurs when prices make lower lows and the RSI makes higher lows. When prices reach higher highs but the RSI displays lower highs, indicating a possible downward trend, this is known as bearish divergence. Centerline Crossovers: The RSI midpoint is 50, indicating trend strength. The RSI indicates an upward momentum that is strengthening when it crosses above 50, and a weakening trend or the beginning of a bearish trend when it crosses below 50. Example: An RSI of 75 for EUR/USD indicates that the pair may be overbought and face a potential downward movement soon. By incorporating the RSI into their strategy, traders can better time entry and exit points in the forex market and enhance risk management. Visit our Social media pages:https://www.instagram.com/hadyjfx_officialhttps://www.youtube.com/@hadyjmentor7793https://www.facebook.com/profile.php?id=61562232239915
What is pinbar price action strategy in forex trading ?
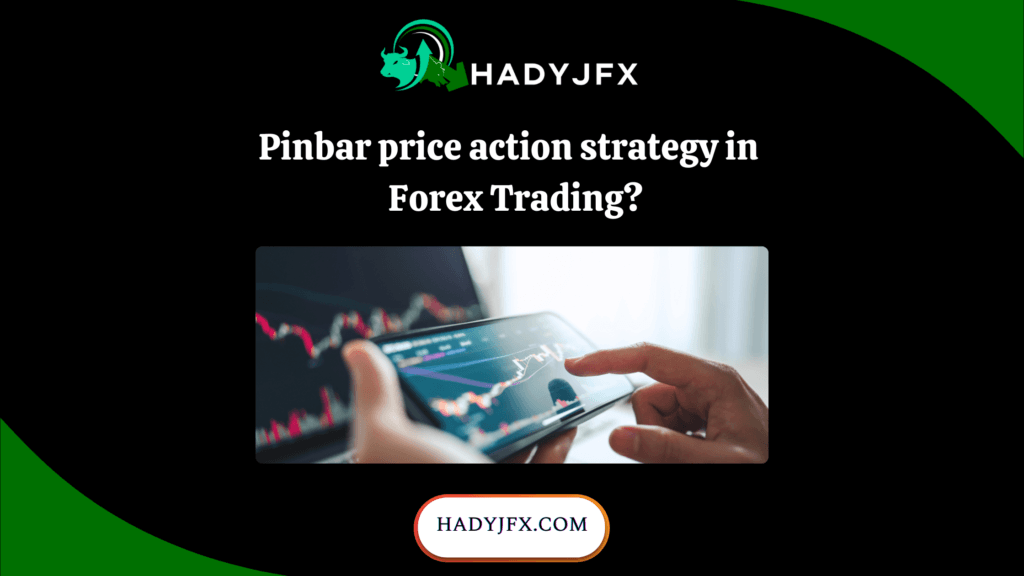
The Pin Bar price action strategy is a popular trading technique in forex that focuses on identifying specific candlestick patterns known as pin bars. This strategy helps traders recognize potential market reversals and make informed trading decisions based on price action. Understanding the Pin Bar A pin bar is distinguished by its small body and lengthy tail, or wick, which denotes a rejection of a particular price level. The key features of a Pin Bar include: Long Wick: The long wick shows that the price moved significantly away from the open, but buyers or sellers stepped in to push the price back towards the open. Small Body: The tiny body signifies uncertainty in the market. The small size of the body relative to the wick shows that the opening and closing prices are close together. Direction: It’s important to point the Pin Bar in the proper direction. A Bullish Pin Bar (tail pointing down) indicates potential upward movement, while a Bearish Pin Bar (tail pointing up) suggests potential downward movement. Trading Strategy Using Pin Bars Identify the Pin Bar: Look for a Pin Bar on the price chart that indicates a rejection of a price level. It should ideally happen at a level of considerable resistance or support. Confirm the Trend: Before entering a trade, confirm the prevailing trend. Trading in the direction of the overall trend can increase the chances of a successful trade. Entry Point: A trade should be initiated when the price exceeds the high of a bullish pin bar or drops below the low of a bearish pin bar, as this validates the reversal signal. Stop Loss Placement: Just below the bullish pin bar’s low or above the bearish pin bar’s high, place your stop loss. In case the market goes against your position, this approach assists in controlling your risk. Take Profit: Set your take profit at a predefined level, which could be based on previous support or resistance levels, or use a risk-to-reward ratio, such as 1:2 or 1:3. Benefits of the Pin Bar Strategy Simplicity: The Pin Bar strategy is straightforward and easy to understand, making it accessible for traders of all experience levels. Price Action Focus: By focussing only on price movement, this technique frees traders from the need for sophisticated indicators to help them make judgements. High Reward Potential: Pin Bars can indicate significant market reversals, leading to profitable trading opportunities. Conclusion The Pin Bar price action strategy is a powerful tool for forex traders, allowing them to identify potential market reversals and make informed trading decisions. By focusing on the characteristics of Pin Bars and employing sound risk management techniques, traders can enhance their trading success in the dynamic forex market. Visit our social media pages:-https://www.instagram.com/hadyjfx_official/https://www.youtube.com/@hadyjmentor7793https://www.facebook.com/profile.php?id=61562232239915
Understand Bullish and Bearish Engulfing Pattern ?
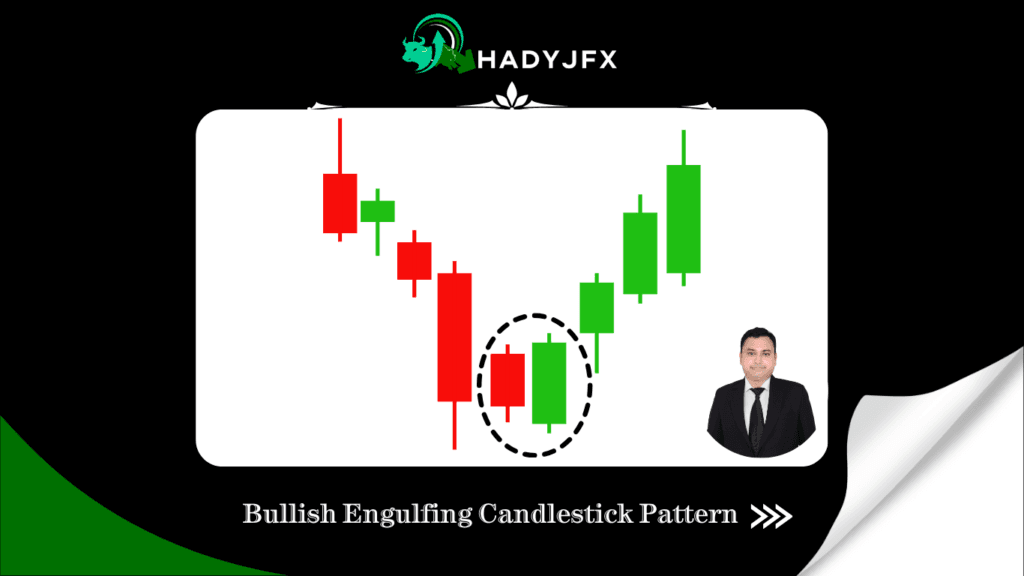
Candlestick patterns are widely used in technical analysis as visual indicators of potential trend reversals and continuation patterns. Two powerful patterns are the bullish engulfing and bearish engulfing candlesticks, each signaling a shift in market sentiment and potential reversal of trends. Recognizing these patterns can provide traders with valuable insight into future price movement and help them time their entry and exit points more effectively. This article will dive into the structure, interpretation, and practical applications of these two patterns in trading. Understanding the Bullish Engulfing Candlestick Pattern A two-candle pattern known as the bullish engulfing pattern typically signals the beginning of a potential uptrend and the end of a decline. The second candle’s body entirely engulfs or covers the body of the previous bearish (downward) candle, which is why this pattern is known as a “engulfing” pattern. Pattern Structure: First Candle: A small bearish candle (red or black) that continues the current downtrend. Second Candle: A large bullish candle (green or white) that opens lower than the first candle but closes higher, fully engulfing the body of the previous bearish candle. When a bullish engulfing pattern appears, it signifies that buyers are entering the market and reversing the selling momentum. This shift in sentiment suggests that the trend might be reversing, creating a buying opportunity for traders. Example Chart:In the chart below, observe how the bullish engulfing pattern appears after a series of bearish candles, signaling a possible upward reversal. Identifying the Bearish Engulfing Candlestick Pattern:The bearish engulfing pattern is the reverse of the bullish engulfing pattern. It suggests that sellers are beginning to control the market and points to a possible reversal at the end of an upward trend. The bearish engulfing pattern has two candles, just like the bullish one: Pattern Structure: First Candle: A small bullish candle that continues the current uptrend. Second Candle: A large bearish candle that opens higher than the previous candle but closes lower, completely engulfing the previous bullish candle. When a bearish engulfing pattern occurs, it signifies that sellers are gaining control, and buyers may be losing strength. This could indicate a market reversal, providing traders with a signal to consider shorting or selling. Example Chart:In the chart below, the bearish engulfing pattern appears at the top of an uptrend, signaling that the trend may be reversing to the downside. Significance of Bullish and Bearish Engulfing PatternsThe bullish and bearish engulfing patterns are essential for several reasons: Trend Reversal Signals: These patterns often indicate potential reversals, helping traders anticipate the shift and adjust their positions accordingly. Market Sentiment Insight: The large body of the engulfing candle suggests a significant change in sentiment, whether it’s from sellers to buyers (bullish) or buyers to sellers (bearish). Easily Recognizable: These patterns are simple to spot on a chart, making them accessible even to beginners. Using Engulfing Patterns in Trading StrategiesHere’s how traders can incorporate engulfing patterns into their strategies: Trend Confirmation: Always look for bullish engulfing patterns at the bottom of a downtrend and bearish engulfing patterns at the top of an uptrend. They are most effective when they appear after a prolonged trend. Entry and Exit Points: Enter a buy trade above the second candle’s high for bullish engulfing. For bearish engulfing, enter a sell trade below the low of the second candle. Setting Stop Losses: Place stop-loss orders slightly below the low of the bullish engulfing pattern and slightly above the high of the bearish engulfing pattern to manage risk in case the pattern fails. Trading Strategy Table: Practical Examples of Engulfing Patterns in Action Example 1 – Bullish Engulfing:Suppose a stock or forex pair has been in a steady downtrend. After the appearance of a little bearish candle, it is fully engulfed by a massive bullish candle. This pattern signals that buyers are gaining control, and a potential upward reversal is about to occur. To profit from the trend reversal, a trader can put a buy order above the second candle’s high. Example 2 – Bearish Engulfing:Examine a currency pair that is strongly rising and displays a little bullish candle that is engulfed by a larger bearish candle. This bearish engulfing pattern suggests that sellers have taken control, and a trend reversal may be imminent. A short-selling position could be initiated by a trader below the second candle’s low.Advantages and Limitations of Engulfing Patterns While bullish and bearish engulfing patterns are powerful indicators, they are not foolproof. False signals can occur, especially in sideways or choppy markets, and it’s best to use them in conjunction with other technical indicators, such as Moving Averages, RSI, or MACD. Common Indicators to Confirm Engulfing PatternsMoving Averages: A crossover of shorter-term moving averages over long-term averages can confirm bullish patterns, while the opposite indicates bearish potential. Relative Strength Index (RSI): Overbought or oversold levels can provide additional confirmation, with overbought levels supporting bearish engulfing and oversold levels supporting bullish engulfing. Volume Analysis: When an engulfing pattern forms, a rise in trade volume lends the pattern legitimacy and validates a significant shift in emotion. ConclusionBullish and bearish engulfing patterns offer traders valuable insights into trend reversals, aiding in identifying strategic entry and exit points. Despite being trustworthy indications, these patterns should be combined with other technical indicators and good risk management techniques. By understanding and applying these patterns correctly, traders can enhance their decision-making and potentially improve profitability in their trading journey. Visit our social media pages:-https://www.instagram.com/hadyjfx_official/https://www.youtube.com/@hadyjmentor7793https://www.facebook.com/profile.php?id=61562232239915 © All Rights Reserved.