Understand Bullish and Bearish Engulfing Pattern ?
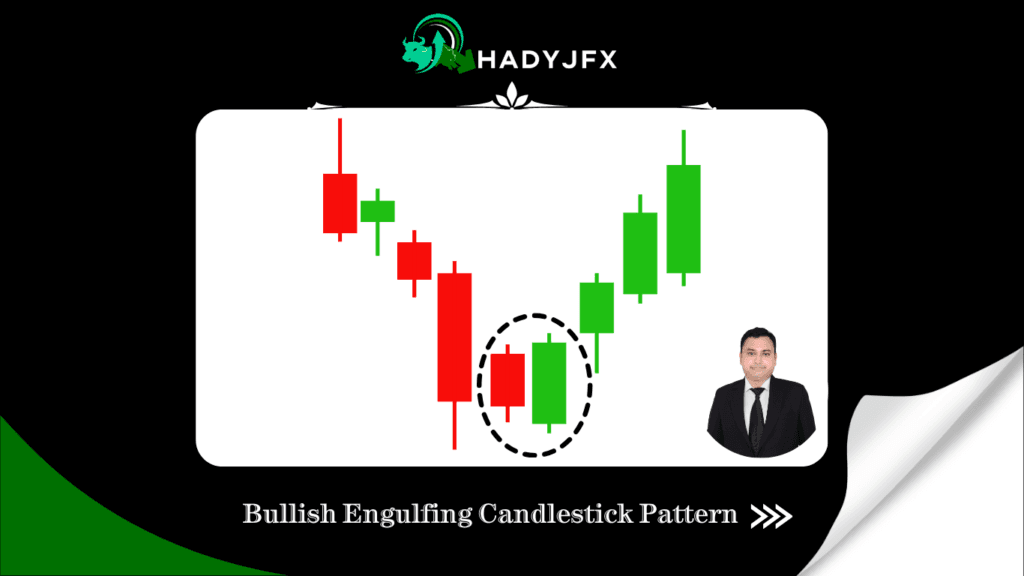
Candlestick patterns are widely used in technical analysis as visual indicators of potential trend reversals and continuation patterns. Two powerful patterns are the bullish engulfing and bearish engulfing candlesticks, each signaling a shift in market sentiment and potential reversal of trends. Recognizing these patterns can provide traders with valuable insight into future price movement and help them time their entry and exit points more effectively. This article will dive into the structure, interpretation, and practical applications of these two patterns in trading. Understanding the Bullish Engulfing Candlestick Pattern A two-candle pattern known as the bullish engulfing pattern typically signals the beginning of a potential uptrend and the end of a decline. The second candle’s body entirely engulfs or covers the body of the previous bearish (downward) candle, which is why this pattern is known as a “engulfing” pattern. Pattern Structure: First Candle: A small bearish candle (red or black) that continues the current downtrend. Second Candle: A large bullish candle (green or white) that opens lower than the first candle but closes higher, fully engulfing the body of the previous bearish candle. When a bullish engulfing pattern appears, it signifies that buyers are entering the market and reversing the selling momentum. This shift in sentiment suggests that the trend might be reversing, creating a buying opportunity for traders. Example Chart:In the chart below, observe how the bullish engulfing pattern appears after a series of bearish candles, signaling a possible upward reversal. Identifying the Bearish Engulfing Candlestick Pattern:The bearish engulfing pattern is the reverse of the bullish engulfing pattern. It suggests that sellers are beginning to control the market and points to a possible reversal at the end of an upward trend. The bearish engulfing pattern has two candles, just like the bullish one: Pattern Structure: First Candle: A small bullish candle that continues the current uptrend. Second Candle: A large bearish candle that opens higher than the previous candle but closes lower, completely engulfing the previous bullish candle. When a bearish engulfing pattern occurs, it signifies that sellers are gaining control, and buyers may be losing strength. This could indicate a market reversal, providing traders with a signal to consider shorting or selling. Example Chart:In the chart below, the bearish engulfing pattern appears at the top of an uptrend, signaling that the trend may be reversing to the downside. Significance of Bullish and Bearish Engulfing PatternsThe bullish and bearish engulfing patterns are essential for several reasons: Trend Reversal Signals: These patterns often indicate potential reversals, helping traders anticipate the shift and adjust their positions accordingly. Market Sentiment Insight: The large body of the engulfing candle suggests a significant change in sentiment, whether it’s from sellers to buyers (bullish) or buyers to sellers (bearish). Easily Recognizable: These patterns are simple to spot on a chart, making them accessible even to beginners. Using Engulfing Patterns in Trading StrategiesHere’s how traders can incorporate engulfing patterns into their strategies: Trend Confirmation: Always look for bullish engulfing patterns at the bottom of a downtrend and bearish engulfing patterns at the top of an uptrend. They are most effective when they appear after a prolonged trend. Entry and Exit Points: Enter a buy trade above the second candle’s high for bullish engulfing. For bearish engulfing, enter a sell trade below the low of the second candle. Setting Stop Losses: Place stop-loss orders slightly below the low of the bullish engulfing pattern and slightly above the high of the bearish engulfing pattern to manage risk in case the pattern fails. Trading Strategy Table: Practical Examples of Engulfing Patterns in Action Example 1 – Bullish Engulfing:Suppose a stock or forex pair has been in a steady downtrend. After the appearance of a little bearish candle, it is fully engulfed by a massive bullish candle. This pattern signals that buyers are gaining control, and a potential upward reversal is about to occur. To profit from the trend reversal, a trader can put a buy order above the second candle’s high. Example 2 – Bearish Engulfing:Examine a currency pair that is strongly rising and displays a little bullish candle that is engulfed by a larger bearish candle. This bearish engulfing pattern suggests that sellers have taken control, and a trend reversal may be imminent. A short-selling position could be initiated by a trader below the second candle’s low.Advantages and Limitations of Engulfing Patterns While bullish and bearish engulfing patterns are powerful indicators, they are not foolproof. False signals can occur, especially in sideways or choppy markets, and it’s best to use them in conjunction with other technical indicators, such as Moving Averages, RSI, or MACD. Common Indicators to Confirm Engulfing PatternsMoving Averages: A crossover of shorter-term moving averages over long-term averages can confirm bullish patterns, while the opposite indicates bearish potential. Relative Strength Index (RSI): Overbought or oversold levels can provide additional confirmation, with overbought levels supporting bearish engulfing and oversold levels supporting bullish engulfing. Volume Analysis: When an engulfing pattern forms, a rise in trade volume lends the pattern legitimacy and validates a significant shift in emotion. ConclusionBullish and bearish engulfing patterns offer traders valuable insights into trend reversals, aiding in identifying strategic entry and exit points. Despite being trustworthy indications, these patterns should be combined with other technical indicators and good risk management techniques. By understanding and applying these patterns correctly, traders can enhance their decision-making and potentially improve profitability in their trading journey. Visit our social media pages:-https://www.instagram.com/hadyjfx_official/https://www.youtube.com/@hadyjmentor7793https://www.facebook.com/profile.php?id=61562232239915 © All Rights Reserved.
Morning Star and Evening Star Candlestick Patterns: A Guide to Identifying Reversals
Traders employ a variety of candlestick patterns in technical analysis to forecast price moves. Two useful reversal patterns are the Morning Star and Evening Star candlestick formations. Traders can spot possible trend reversals with the aid of these patterns, which frequently indicate a shift in market mood. The creation, significance, and real-world trading applications of these two candlestick patterns will all be covered in this essay. A Morning Star Candlestick Pattern: What Is It?The Morning Star pattern is one bullish reversal indication. It emerges at the conclusion of a downward trend and suggests a possible upward trend reversal. Usually, there are three candlesticks in this pattern: First Candle: A big red, bearish candlestick that validates the present downward trend. Second Candle: A small-bodied candle that indicates market hesitation and can be either bullish (green) or bearish. Long wicks on this candle are frequently used to represent market turbulence and price volatility. Third Candle: A sizable green, bullish candlestick that ends close to the peak of the day’s range, preferably above the first bearish candle’s midpoint. According to the Morning Star, bulls (buyers) are taking over to drive prices upward as bears (sellers) are losing ground. Morning Star Candlestick Pattern Chart Chart Example:Take note of the Morning Star candlestick pattern that follows a downward trend in the chart below. A change from negative to bullish attitude is shown by the enormous bearish candle, which is followed by a smaller, unsure candle, then a strong bullish candle at the end. An Evening Star Candlestick Pattern: What Is It?The Morning Star’s pattern is reversed in the Evening Star’s. Following an upward trend, this bearish reversal pattern emerges, suggesting a possible downward reversal. Three candles are also included in the Evening Star: First Candle: The present upward trend is confirmed by a sizable bullish (green) candlestick. Second Candle: A bearish or bullish small-bodied candle that suggests a trend reversal by displaying market hesitancy. Third Candle: A sizable red bearish candlestick that closes close to the day’s range’s bottom, preferably beneath the first bullish candle’s midpoint. The Evening Star pattern suggests that bears may be taking over and driving prices lower as the bulls lose market dominance. Evening Star Candlestick Pattern Chart Chart Example: The chart below displays the Evening Star pattern after an upward trend. A change from bullish to bearish emotion is indicated by the first big bullish candle, which is followed by a smaller, unsure candle, then a strong bearish candle at the end. Crucial Elements for Recognizing Morning and Evening Star PatternsEven though these patterns are somewhat simple, it’s crucial to adhere to specific rules to ensure their validity: Trend Requirement: After a downturn, morning stars should emerge, and following an uptrend, evening stars should form. They might be less successful if they seem to be in the middle of a trend. Candle Gap: The pattern may be strengthened by the space between the first and second candles as well as the second and third candles. While gaps may occur less frequently in forex trading, they are more prevalent in high-volume markets. Volume Confirmation: An increase in volume on the third candle indicates that buyers (Morning Star) or sellers (Evening Star) are gaining ground in markets where volume data is available. Relative Size of Candles: The third candle should be big enough to indicate a significant reversal. Realistic Uses and TechniquesMorning Star and Evening Star patterns are commonly used by traders as part of a larger trading plan. The following useful advice is provided: Combining these patterns with technical indicators like Moving Averages, RSI, or MACD might help traders increase the patterns’ dependability. Establish Entry and Exit Points: The Morning Star’s best entry position would be just above the third candlestick’s high. For the Evening Star, think about taking a short position just below the third candle’s low. Risk management: Since reversals don’t always work, by placing a stop-loss close to the pattern’s high or low, you can guard against misleading signals. Table of Potential Trading Strategy Examples of the Morning and Evening Star in Action Example 1-Morning Star:Consider a pair of currencies that has been steadily declining. With a tiny second candle and a powerfully bullish third candle, the Morning Star pattern emerges. You place a buy trade above the high of the third candle, indicating a potential bullish reversal, with a stop loss below the bottom of the second candle. Example 2: Evening Star: Let’s look at an uptrending currency pair where an Evening Star pattern appears. A reversal is likely, as indicated by the second candle’s small body and the third candle’s negative outlook. If the price continues to decline, it may be lucrative to enter a sell position below the low of the third candle and set a stop loss above the high of the second candle. The Morning Star and Evening Star Patterns’ Benefits and Drawbacks Traders looking to profit from market reversals may find these candlestick patterns to be highly effective indicators. To control risk, it’s crucial to validate the trends using additional indicators and modify stop-loss levels. In conclusionA trader’s arsenal should include the Morning Star and Evening Star candlestick patterns. They help traders spot possible reversal moments by offering insights into shifts in market sentiment. Keep in mind that no pattern is infallible; technical indicators, prudent risk management, and a careful examination of market trends are the best ways to use these candlestick patterns. Whether in stocks, forex, or other financial markets, these patterns can present lucrative possibilities if properly identified. To make well-informed trading selections, incorporate these forms into your analysis and make good use of them. Visit Our Social Media Pages:-https://www.instagram.com/hadyjfx_official/https://www.youtube.com/@hadyjmentor7793https://www.facebook.com/profile.php?id=61562232239915 © All Rights Reserved.
What is a Pip, Leverage & Margin in Forex Trading?
A pip (short for “percentage in point” or “price interest point”) is the smallest price movement that a currency pair can make in the forex market. In most currency pairs, a pip is equal to 0.0001, or one-hundredth of one percent. Pips are a key concept in forex trading, as they are used to measure price changes and calculate profits or losses. For example, if the EUR/USD currency pair moves from 1.1000 to 1.1001, that is a movement of 1 pip. Pips are a useful tool for traders to measure trade performance, establish stop-loss orders, and manage risk. In some currency pairs, like those involving the Japanese Yen (e.g., USD/JPY), a pip is equal to 0.01 due to the currency’s lower relative value. Why Are Pips Important? Pips play a critical role in: Calculating Spread: Brokers charge the difference between the bid and ask price of a currency pair in pips. Risk Management: Traders set stop-loss and take-profit levels based on pip movements. Measuring Profit and Loss: Changes in pip value directly affect a trader’s potential gain or loss on a trade. Explanation: EUR/USD: went from 1.1000 to 1.1005, a 5 pip increase. GBP/USD: The price dropped by 20 pips (from 1.3050 to 1.3030). USD/JPY: Since pips for JPY pairs are measured in two decimal places, the price movement of 0.05 equals 5 pips. AUD/USD: From 0.7150 to 0.7140, the price dropped by 10 pip. USD/CAD: The price increased by 20 pips (from 1.3200 to 1.3220). Leverage in forex trading allows traders to control a larger position in the market with a relatively small amount of their own capital. It is essentially borrowed capital from the broker, enabling traders to amplify their potential profits (or losses) by controlling a higher trade value than their initial investment. For example, if a broker offers 100:1 leverage, it means that for every $1 of your own money, you can control $100 in the market. At 100:1 leverage, $1,000 can be used to purchase ownership of a $100,000 stake. Key Concepts of Leverage: Amplifies Gains and Losses:Profit and loss potential are both increased by leverage. If the market moves in your favor, leverage can lead to significant profits. However, if the market moves against you, losses can be just as large. Margin Requirement:To use leverage, traders must maintain a certain amount of money in their account, called the margin. The leveraged trade uses this margin as collateral. Example of Leverage: Assume your trading account balance is $1,000. You use 100:1 leverage, meaning you can trade up to $100,000 worth of currency. A 1% movement in the market in your favor would net you $1,000, or a 100% return on your initial investment. On the other hand, if the market swings 1% against you, you might lose $1,000, wiping out your entire balance. Benefits of Leverage: Maximizes Trading Opportunities:Traders with smaller capital can still trade larger positions, increasing their potential for profit. More Market Exposure:Leverage enables traders to participate in larger trades, gaining exposure to a wider range of market movements. Risks of Leverage: Raises Risk:Leverage can make gains appear larger, but it can also make losses appear larger. If the market moves against a trader, they could lose more than their initial investment. Margin Calls:If a trade moves against a trader significantly, the broker may issue a margin call, requiring the trader to deposit additional funds to maintain the position. Failure to do so could result in the broker closing the position at a loss. Key Takeaways: With higher leverage, even a small price movement can result in a significant profit or loss. In the second and third examples, the same pip movement (+50 pips or -50 pips) results in a $500 gain or loss because of 100:1 leverage. The last two rows illustrate that increased leverage (100:1) can lead to bigger losses or gains compared to 50:1 leverage, even with the same price movement. In forex trading, margin refers to the amount of money that a trader must deposit with their broker to open a leveraged position. It is essentially a good-faith deposit that the broker holds while the position is active. Margin is not a cost or a fee but serves as collateral to maintain the trader’s open positions. Traders can manage bigger holdings with less capital thanks to margin. It guarantees that traders have sufficient funds to offset any losses. The margin requirement varies based on the broker and the leverage used in trading. Key Concepts of Margin Requirement:This is the percentage of the trade’s total value that a trader needs to deposit to open a position. For instance, you must deposit 1% of the entire deal size if the margin requirement is 1%. Free Margin:This is the amount of money left in your account that is not tied to any open positions and can be used to open additional trades. Used Margin:This is the quantity of capital that is presently involved in open trades. Margin Call:If the market moves against a trader, their equity may fall below the broker’s required margin. If this happens, the broker may issue a margin call, requiring the trader to deposit additional funds or close out positions to maintain the trade. Example of Assume you want to open a position worth $100,000 and your broker requires a 1% margin. This means you need to deposit $1,000 (1% of $100,000) to open the trade. The remaining $99,000 is provided by the broker via leverage. Benefits of Using Increased Buying Power:With margin, traders may manage bigger holdings with less money. Higher Potential Returns:By using margin, traders can amplify potential profits since they are controlling a larger position with a smaller investment. Risks of Using Amplified Losses:Losses can also be magnified, just like gains can. The loss will be higher than it would have been if you hadn’t employed leverage if the market moves against you. Margin Calls:If the account balance falls below the required margin, a margin call may force you to add funds or close positions. Key Takeaways: The
What is Forex Trading?
Traders employ a variety of candlestick patterns in technical analysis to forecast price moves. Two useful reversal patterns are the Morning Star and Evening Star candlestick formations. Traders can spot possible trend reversals with the aid of these patterns, which frequently indicate a shift in market mood. The creation, significance, and real-world trading applications of these two candlestick patterns will all be covered in this essay. A Morning Star Candlestick Pattern: What Is It?The Morning Star pattern is one bullish reversal indication. It emerges at the conclusion of a downward trend and suggests a possible upward trend reversal. Usually, there are three candlesticks in this pattern: First Candle: A big red, bearish candlestick that validates the present downward trend. Second Candle: A small-bodied candle that indicates market hesitation and can be either bullish (green) or bearish. Long wicks on this candle are frequently used to represent market turbulence and price volatility. Third Candle: A sizable green, bullish candlestick that ends close to the peak of the day’s range, preferably above the first bearish candle’s midpoint. According to the Morning Star, bulls (buyers) are taking over to drive prices upward as bears (sellers) are losing ground. Morning Star Candlestick Pattern Chart Chart Example:Take note of the Morning Star candlestick pattern that follows a downward trend in the chart below. A change from negative to bullish attitude is shown by the enormous bearish candle, which is followed by a smaller, unsure candle, then a strong bullish candle at the end. An Evening Star Candlestick Pattern: What Is It?The Morning Star’s pattern is reversed in the Evening Star’s. Following an upward trend, this bearish reversal pattern emerges, suggesting a possible downward reversal. Three candles are also included in the Evening Star: First Candle: The present upward trend is confirmed by a sizable bullish (green) candlestick. Second Candle: A bearish or bullish small-bodied candle that suggests a trend reversal by displaying market hesitancy. Third Candle: A sizable red bearish candlestick that closes close to the day’s range’s bottom, preferably beneath the first bullish candle’s midpoint. The Evening Star pattern suggests that bears may be taking over and driving prices lower as the bulls lose market dominance. Evening Star Candlestick Pattern Chart Chart Example: The chart below displays the Evening Star pattern after an upward trend. A change from bullish to bearish emotion is indicated by the first big bullish candle, which is followed by a smaller, unsure candle, then a strong bearish candle at the end. Crucial Elements for Recognizing Morning and Evening Star PatternsEven though these patterns are somewhat simple, it’s crucial to adhere to specific rules to ensure their validity: Trend Requirement: After a downturn, morning stars should emerge, and following an uptrend, evening stars should form. They might be less successful if they seem to be in the middle of a trend. Candle Gap: The pattern may be strengthened by the space between the first and second candles as well as the second and third candles. While gaps may occur less frequently in forex trading, they are more prevalent in high-volume markets. Volume Confirmation: An increase in volume on the third candle indicates that buyers (Morning Star) or sellers (Evening Star) are gaining ground in markets where volume data is available. Relative Size of Candles: The third candle should be big enough to indicate a significant reversal. Realistic Uses and TechniquesMorning Star and Evening Star patterns are commonly used by traders as part of a larger trading plan. The following useful advice is provided: Combining these patterns with technical indicators like Moving Averages, RSI, or MACD might help traders increase the patterns’ dependability. Establish Entry and Exit Points: The Morning Star’s best entry position would be just above the third candlestick’s high. For the Evening Star, think about taking a short position just below the third candle’s low. Risk management: Since reversals don’t always work, by placing a stop-loss close to the pattern’s high or low, you can guard against misleading signals. Table of Potential Trading Strategy Examples of the Morning and Evening Star in Action Example 1-Morning Star:Consider a pair of currencies that has been steadily declining. With a tiny second candle and a powerfully bullish third candle, the Morning Star pattern emerges. You place a buy trade above the high of the third candle, indicating a potential bullish reversal, with a stop loss below the bottom of the second candle. Example 2: Evening Star: Let’s look at an uptrending currency pair where an Evening Star pattern appears. A reversal is likely, as indicated by the second candle’s small body and the third candle’s negative outlook. If the price continues to decline, it may be lucrative to enter a sell position below the low of the third candle and set a stop loss above the high of the second candle. The Morning Star and Evening Star Patterns’ Benefits and Drawbacks Traders looking to profit from market reversals may find these candlestick patterns to be highly effective indicators. To control risk, it’s crucial to validate the trends using additional indicators and modify stop-loss levels. In conclusionA trader’s arsenal should include the Morning Star and Evening Star candlestick patterns. They help traders spot possible reversal moments by offering insights into shifts in market sentiment. Keep in mind that no pattern is infallible; technical indicators, prudent risk management, and a careful examination of market trends are the best ways to use these candlestick patterns. Whether in stocks, forex, or other financial markets, these patterns can present lucrative possibilities if properly identified. To make well-informed trading selections, incorporate these forms into your analysis and make good use of them. Visit Our Social Media Pages:-https://www.instagram.com/hadyjfx_official/https://www.youtube.com/@hadyjmentor7793https://www.facebook.com/profile.php?id=61562232239915