Forex trading is not only about identifying whether the market is moving up or down, but also about understanding how strong that movement is. Many traders enter trades based on direction alone and end up facing losses because the trend lacks strength. This is where the ADX indicator becomes extremely important. The Average Directional Index, commonly known as ADX, is designed to measure the strength of a trend, helping traders avoid weak market conditions and focus only on high-probability opportunities.
In the fast-paced forex market, false signals are one of the biggest challenges traders face. Indicators may suggest a buy or sell opportunity, but without proper confirmation of trend strength, these signals often fail. ADX helps solve this problem by filtering out weak trends and highlighting strong ones. This makes it an essential tool for traders who want consistency and better decision-making.
What is ADX Indicator?
The ADX indicator is a technical analysis tool developed by J. Welles Wilder. It is part of a broader system known as the Directional Movement System, which includes two additional lines called the Positive Directional Indicator (+DI) and the Negative Directional Indicator (-DI). The +DI and –DI indicators are used together with ADX to determine the market’s direction.
The ADX line moves between 0 and 100. A low value indicates a weak or non-existent trend, while a high value indicates a strong trend. One of the unique aspects of ADX is that it does not tell you whether the market is bullish or bearish. Instead, it tells you whether the trend, regardless of direction, is strong enough to trade.
How ADX Works in Forex Trading
The ADX indicator works by analyzing price movements and calculating the strength of directional movement. It compares the difference between highs and lows over a specific period and determines whether the market is trending or ranging.
When the ADX value starts increasing, it means that the trend is gaining strength. When the ADX value starts decreasing, it indicates that the trend is weakening. This information helps traders decide whether to stay in a trade, exit a position, or avoid trading altogether.
The +DI and -DI lines work alongside ADX to show direction. When +DI is above -DI, it suggests bullish strength. When -DI is above +DI, it indicates bearish strength. Using these indicators together allows traders to evaluate both the trend direction and its overall strength more clearly.
Understanding ADX Levels
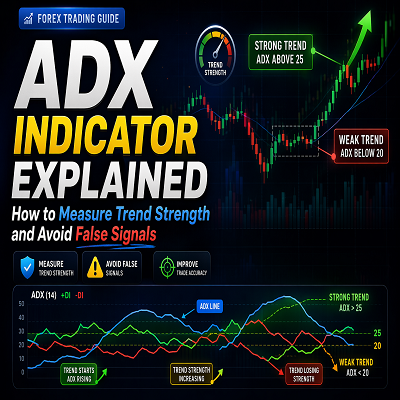
Interpreting ADX levels correctly is essential for making effective trading decisions. An ADX reading under 20 generally shows that the market is moving sideways without a clear trend. During these conditions, trend-based strategies tend to perform poorly due to the lack of a strong directional move.
An ADX value between 20 and 40 often signals that a new trend is developing. This is a phase where traders start preparing for potential opportunities. When the ADX crosses above 40, it reflects a powerful and well-established trend. This is typically the best time to apply trend-following strategies.
However, extremely high ADX values may indicate that the trend is overextended. In such cases, traders should be cautious as the market may slow down or reverse.
Importance of +DI and -DI Lines
While ADX measures trend strength, the +DI and -DI lines provide direction. These lines help traders understand whether buyers or sellers are dominating the market.
When the +DI line crosses above the -DI line, it indicates that buyers are gaining control and the market may move upward. When the -DI line crosses above the +DI line, it suggests that sellers are in control and the market may move downward.
These crossovers can act as entry signals, especially when supported by a rising ADX. However, traders should avoid relying solely on crossovers, as they can sometimes produce false signals in weak markets.
ADX Trend Strength Strategy
One of the most effective ways to use ADX is to focus on trading only when the trend is strong. Traders can set a rule to enter trades only when ADX is above a certain level, such as 20 or 25.
For example, if ADX is above 25 and the +DI line is above the -DI line, it indicates a strong uptrend. In this case, traders look for buying opportunities. Similarly, if ADX is above 25 and the -DI line is above the +DI line, it indicates a strong downtrend, and traders look for selling opportunities.
This strategy helps traders avoid low-quality trades and focus on strong market movements.
Using ADX to Avoid False Signals
False signals are one of the biggest reasons traders lose money. Many indicators generate signals even when the market is not trending, leading to unnecessary losses.
ADX acts as a filter that helps traders avoid such situations. If ADX is below 20, it indicates that the market is weak, and traders may choose to stay out of the market.
By waiting for ADX to rise before entering trades, traders can significantly improve their accuracy and reduce risk.
ADX Breakout Confirmation Strategy
ADX is also useful for confirming breakouts. When the market is in a consolidation phase, ADX values are usually low. When a breakout occurs, ADX starts to rise, indicating that the trend is gaining strength.
Traders can use this behavior to confirm whether a breakout is valid. A breakout with rising ADX is more likely to continue, while a breakout with low ADX may fail.
This approach helps traders avoid false breakouts and enter trades with greater confidence.
Combining ADX with Moving Averages
Combining ADX with moving averages creates a powerful trading strategy. Moving averages help identify trend direction, while ADX confirms the strength of that trend.
For example, if the price is above a moving average and ADX is rising, it indicates a strong uptrend. Traders can use this confirmation to enter buy trades.
This combination improves trade accuracy and reduces false signals.
ADX Divergence Concept
Although not as commonly used as RSI divergence, ADX divergence can provide valuable insights. If the price is making higher highs but ADX is decreasing, it indicates that the trend is losing strength.
Similarly, if the price is making lower lows but ADX is falling, it suggests that the bearish trend is weakening.
This information can help traders prepare for potential reversals or trend slowdowns.
Best Timeframes for ADX Trading
ADX can be used on all timeframes, making it suitable for different trading styles. Short-term traders may use lower timeframes like 5-minute or 15-minute charts.
Swing traders often prefer 1-hour or 4-hour charts, while long-term traders use daily charts.
The key is to choose a timeframe that aligns with your strategy and trading goals.
Common Mistakes When Using ADX
Many traders misuse the ADX indicator due to a lack of understanding. One common mistake is assuming that a high ADX value indicates a reversal. In reality, a high ADX simply means the trend is strong.
Another mistake is ignoring the +DI and -DI lines and focusing only on the ADX line. Without direction, ADX alone cannot provide complete information.
Traders also use ADX in isolation without combining it with other tools, which can lead to inaccurate decisions.
Advantages of ADX Indicator
The ADX indicator offers several advantages. It helps traders identify strong trends and avoid weak market conditions. It also works well with other indicators and can be applied across different markets and timeframes.
By focusing on trend strength, ADX improves trade selection and increases the probability of success.
Limitations of ADX Indicator
Despite its benefits, ADX has some limitations. It is a lagging indicator, meaning it reacts after the trend has already started. This can lead to delayed entries.
It also does not indicate direction on its own, so traders must rely on +DI and -DI lines.
Understanding these limitations helps traders use ADX more effectively.
How Beginners Should Start Using ADX
Beginners should start by learning how ADX measures trend strength and practice using it on demo accounts.
They should focus on identifying strong and weak trends rather than trying to predict reversals.
Combining ADX with simple tools like moving averages can help build confidence and improve results.
Trading Psychology and Discipline
Even with a powerful indicator like ADX, success in trading depends on discipline and emotional control. Traders must avoid overtrading and follow their strategy consistently.
Patience is important, as waiting for strong trends can lead to better opportunities.
Conclusion
The ADX indicator is a powerful tool that helps traders measure trend strength and avoid false signals. By understanding how ADX works and combining it with other indicators, traders can improve their decision-making and focus on high-probability trades.
While it requires practice to master, ADX can become an essential part of a successful trading strategy. Forex trading is not just about predicting direction but also about understanding strength, and ADX provides that crucial insight.
Join Our Community
Instagram: https://www.instagram.com/hadyjfx_official
YouTube: https://www.youtube.com/@hadyjmentor7793
Facebook: https://www.facebook.com/profile.php?id=61562232239915
Join Telegram: https://t.me/hadyjfx