In forex trading, understanding both market momentum and trend direction is very important for consistent results. Many traders fail not because they cannot see the trend, but because they don’t confirm whether that trend is strong enough to continue. This is where the MACD indicator becomes extremely useful.
The Moving Average Convergence Divergence (MACD) is a powerful and flexible indicator that helps traders analyze trend direction, measure momentum strength, and identify possible reversal points. It is popular among both beginners and experienced traders because it is easy to use and highly effective.
Whether you are new to trading or already have experience, learning how to properly use MACD can improve your decision-making and help you trade with more confidence.
What is MACD Indicator?
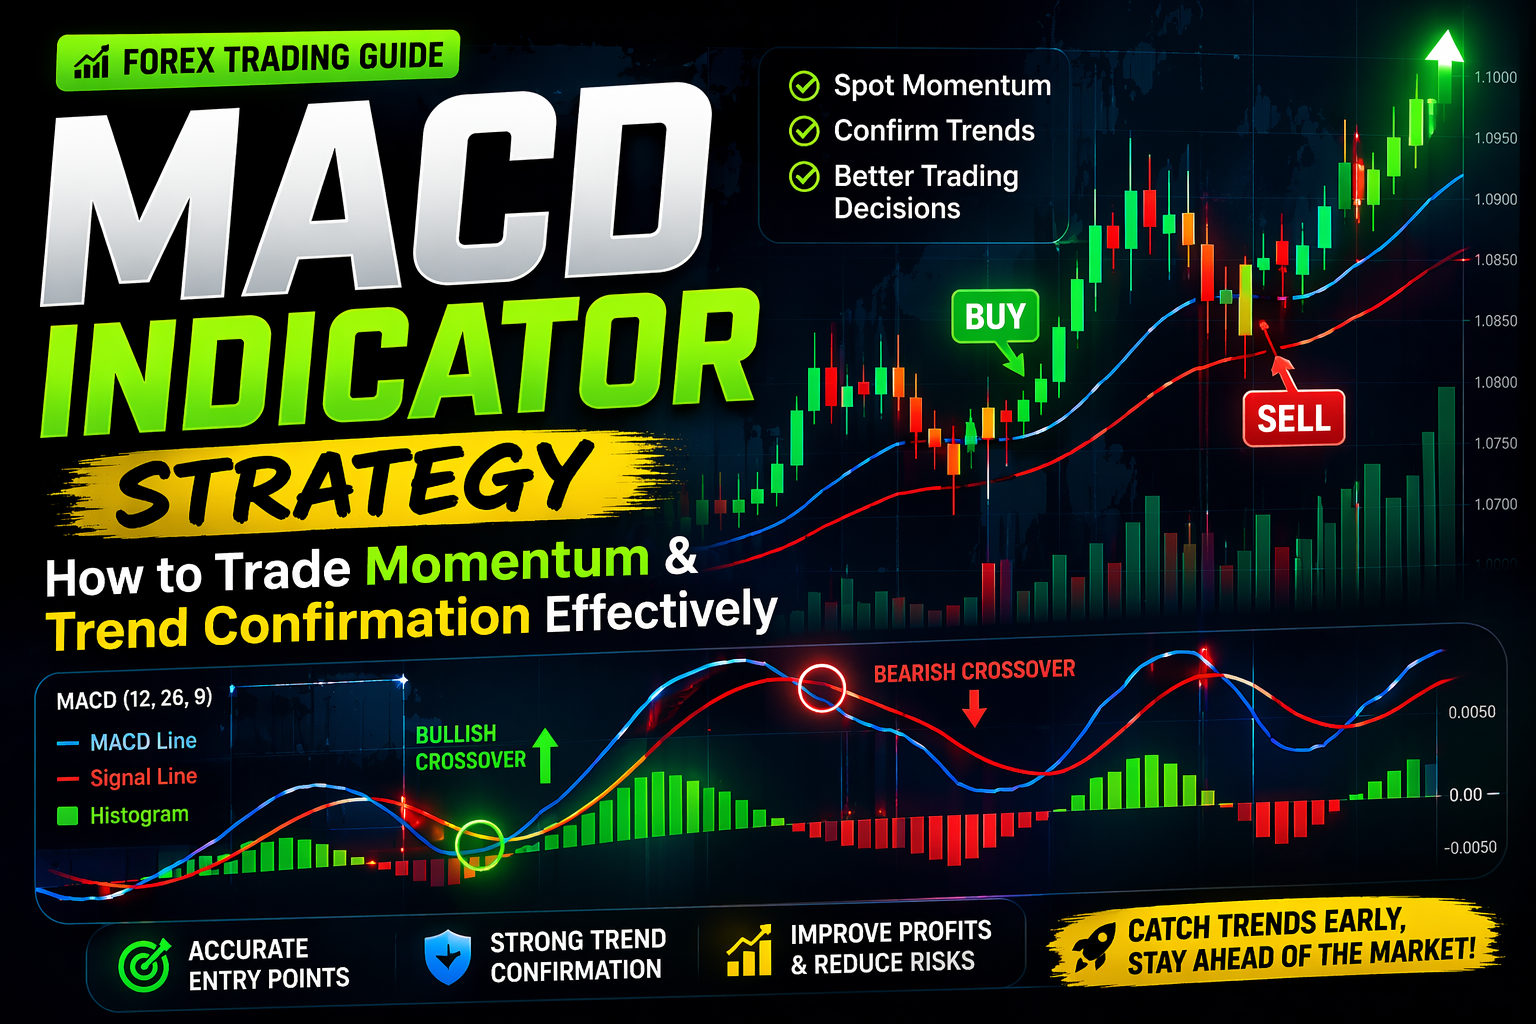
MACD is a trend-following momentum indicator created by Gerald Appel. It is made up of three main elements: the MACD line, the signal line, and the histogram.
The MACD line is formed by calculating the difference between a short-term moving average and a long-term moving average. The signal line is simply a smoothed average of the MACD line. The histogram shows the gap between these two lines.
Because of this structure, traders can easily see both trend direction and momentum strength in one place.
How MACD Works in Forex Trading
MACD works by comparing two moving averages and tracking how they move relative to each other. When the short-term average starts moving further away from the long-term average, it shows that momentum is increasing.
If the MACD line moves above the signal line, it usually signals bullish momentum. On the other hand, when it moves below the signal line, it indicates bearish momentum.
The histogram helps traders understand how strong that momentum is. Larger bars mean stronger momentum, while smaller bars suggest that momentum is slowing down.
Understanding MACD Components
To use MACD properly, you must clearly understand each part of the indicator.
The MACD line shows the overall momentum direction by measuring the difference between two averages.
The signal line acts like a trigger, helping traders decide when to enter or exit trades.
The histogram gives a visual representation of the distance between both lines, making it easier to spot changes in momentum quickly.
MACD Crossover Strategy
One of the simplest and most commonly used strategies is the crossover method.
A buying opportunity appears when the MACD line crosses above the signal line, showing increasing bullish pressure.
A selling opportunity appears when the MACD line crosses below the signal line, indicating growing bearish pressure.
This method works best when the market is trending clearly, rather than moving sideways.
MACD Zero Line Strategy
The zero level is another important part of MACD.
When the MACD line moves above zero, it shows that the market is gaining bullish strength. When it drops below zero, it suggests bearish control.
Traders often use this level to confirm the overall trend direction. If MACD stays above zero, they focus more on buying opportunities. If it remains below zero, they prefer selling setups.
MACD Divergence Strategy
Divergence is a powerful signal that can warn about possible trend reversals.
A bullish divergence happens when price creates lower lows, but MACD forms higher lows. This suggests that selling pressure is weakening.
A bearish divergence happens when price makes higher highs, but MACD creates lower highs, indicating weakening buying strength.
This concept helps traders catch reversals earlier than usual.
MACD Histogram Strategy
The histogram gives additional information about momentum changes.
When the bars are growing taller, it shows that momentum is becoming stronger. When the bars begin to shrink, it signals that momentum is losing strength.
Traders use this to decide whether to stay in a trade or exit before the market reverses.
MACD Trend Confirmation Strategy
MACD is also very useful for confirming trends.
If both the MACD line and signal line are above zero, it confirms a strong upward trend.
If both lines are below zero, it confirms a strong downward trend.
This helps traders avoid taking trades against the main trend direction.
Combining MACD with Other Indicators
MACD becomes even more reliable when used with other tools.
For example, combining it with RSI helps identify overbought and oversold conditions more accurately.
Using moving averages can strengthen trend confirmation, while support and resistance levels can improve entry timing.
This combination reduces false signals and increases overall accuracy.
Common Mistakes When Using MACD
Many traders misuse MACD and face losses.
One common mistake is depending only on crossover signals without checking the overall trend.
Another issue is entering trades too late, since MACD reacts after price movement.
Ignoring risk management is also a big mistake that can lead to heavy losses.
Avoiding these errors can improve trading performance.
Best Timeframes for MACD Trading
MACD can be used on different timeframes depending on your trading style.
Scalpers prefer lower timeframes like 5-minute or 15-minute charts.
Swing traders usually use 1-hour or 4-hour charts.
Long-term traders rely on daily charts for bigger trends.
Choosing the right timeframe is very important for success.
Advantages of MACD Indicator
MACD is simple and beginner-friendly.
It provides clear signals for both trend and momentum.
It works well across multiple markets and timeframes.
Limitations of MACD Indicator
MACD is a lagging indicator, meaning signals may appear after the move has already started.
It may also give false signals during sideways or choppy markets.
That’s why combining it with other tools is recommended.
How Beginners Should Use MACD
Beginners should start with basic strategies like crossovers and zero line confirmation.
Practicing on demo accounts is very important before trading real money.
Focus on consistency instead of quick profits, and always follow proper risk management.
Trading Psychology and Discipline
Success in trading is not just about strategy, but also about mindset.
Emotions like fear and greed can lead to poor decisions.
Traders should stick to their plan and avoid impulsive actions.
Discipline is the key to long-term success.
Compounding and Long-Term Growth
Making small profits consistently is better than chasing big gains.
Over time, these small profits can grow significantly through compounding.
Patience and consistency are more important than quick success.
Conclusion
The MACD indicator is one of the most effective tools for understanding momentum and confirming trends in forex trading.
By applying strategies like crossovers, divergence, and zero line confirmation, traders can make better decisions and improve accuracy.
Although it takes time to master, MACD can become a powerful part of any trading system.
Forex trading is a long-term journey, and with the right tools and discipline, traders can achieve consistent growth.
Join Our Community
Instagram: https://www.instagram.com/hadyjfx_official
YouTube: https://www.youtube.com/@hadyjmentor7793
Facebook: https://www.facebook.com/profile.php?id=61562232239915
Join Telegram: https://t.me/hadyjfx