Forex trading is not just about identifying trends, but also about finding the right entry and exit points. Many traders struggle not because they don’t understand the market direction, but because they enter trades too early or too late. This is where momentum indicators like the Stochastic Indicator become extremely valuable.
The Stochastic Indicator is one of the most effective tools for timing the market. It helps traders identify when the market is overbought or oversold and provides signals for potential reversals. Whether you are a beginner learning the basics or an experienced trader looking to improve timing accuracy, the Stochastic Indicator can significantly enhance your trading performance.
What is the Stochastic Indicator?
The Stochastic Indicator is a momentum oscillator that compares the closing price of an asset to its price range over a specific period. It was developed by George Lane and is widely used in forex trading to identify overbought and oversold conditions.
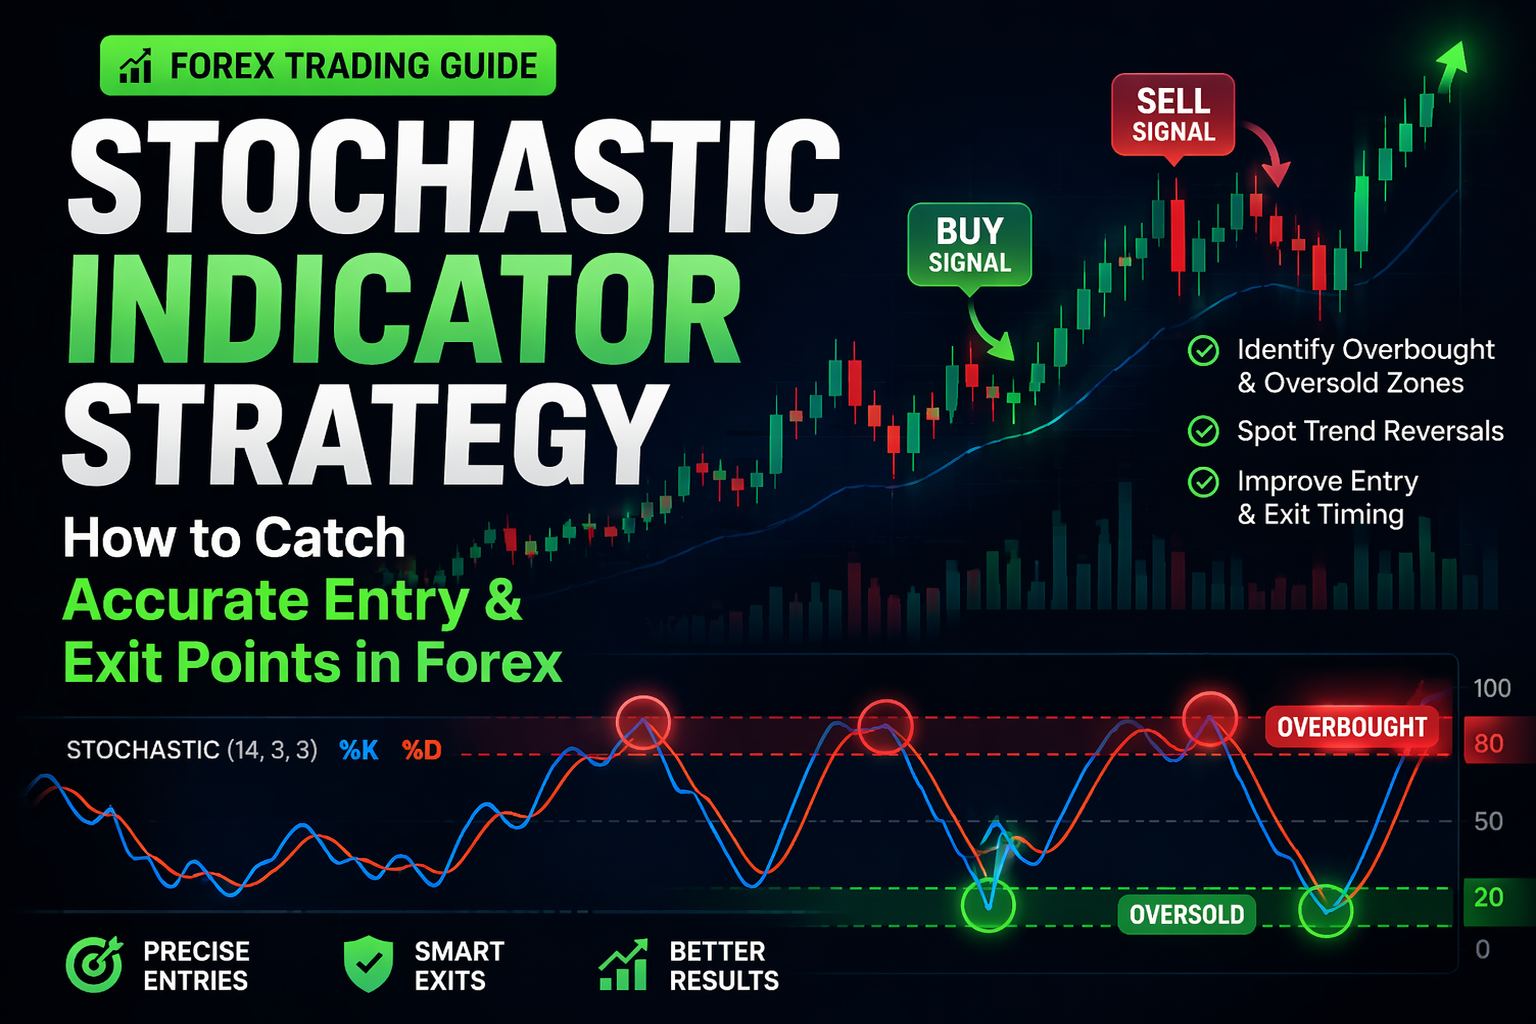
The indicator moves between 0 and 100 and consists of two lines: %K and %D. The %K line represents the primary signal, while the %D line is a smoothed version derived from %K.
When the Stochastic value is above 80, it indicates that the market may be overbought. When it is below 20, it suggests that the market may be oversold.
How the Stochastic Indicator Works
The Stochastic Indicator is based on the idea that in an uptrend, prices tend to close near the high of the range, and in a downtrend, they tend to close near the low.
When the indicator moves upward, it shows increasing bullish momentum. When it moves downward, it reflects increasing bearish pressure.
The interaction between the %K and %D lines creates trading signals. When %K crosses above %D, it indicates a potential buying opportunity. When %K crosses below %D, it suggests a selling opportunity.
Understanding Overbought and Oversold Levels
The most common use of the Stochastic Indicator is to identify overbought and oversold conditions.
A buying opportunity is identified when the %K line moves above the %D line while the indicator is below 20. This means the price may have risen too quickly and could reverse or correct.
When the indicator drops under 20, it signals that the market may be oversold and could be ready for a potential rebound. This indicates that the price may have dropped too much and could bounce back.
However, just like any indicator, these levels should not be used alone. In strong trends, the market can remain overbought or oversold for extended periods.
Stochastic Indicator Entry Strategy
The Stochastic Indicator is widely used for precise entry timing. Traders look for crossovers between the %K and %D lines in key zones.
A buy signal occurs when the %K line crosses above the %D line in the oversold zone (below 20). This suggests that bullish momentum is starting to build.
A sell signal occurs when the %K line crosses below the %D line in the overbought zone (above 80). This indicates that bearish momentum may be increasing.
This strategy is simple yet effective and is widely used by traders of all experience levels.
Stochastic Indicator Exit Strategy
The Stochastic Indicator is also useful for exit timing. Traders can use it to determine when to close a trade and secure profits.
For example, if a trader enters a buy trade from the oversold zone, they may consider exiting when the indicator approaches the overbought zone.
Similarly, for sell trades, exiting near the oversold zone can help lock in profits.
This approach helps traders avoid staying in trades for too long and reduces the risk of reversals.
Stochastic Divergence Strategy
Divergence is one of the most powerful techniques in trading. It occurs when price and the indicator move in opposite directions.
If the price is making higher highs but the Stochastic Indicator is making lower highs, it indicates weakening momentum and a potential reversal.
If the price is making lower lows while the indicator is making higher lows, it suggests that bearish momentum is weakening and a bullish reversal may occur.
Divergence helps traders identify early signals of trend changes.
Stochastic with Trend Confirmation
While the Stochastic Indicator is often used for reversals, it can also be used in trending markets.
In an uptrend, traders look for buy signals when the indicator moves from oversold levels. In a downtrend, they look for sell signals from overbought levels.
This approach ensures that traders align with the overall market trend instead of trading against it.
Combining Stochastic with Other Indicators
The Stochastic Indicator becomes more powerful when combined with other tools. For example, combining it with moving averages helps confirm the trend.
Using it with RSI can provide stronger confirmation of overbought and oversold conditions.
Support and resistance levels can further improve entry accuracy.
This combination reduces false signals and increases trading confidence.
Common Mistakes When Using Stochastic Indicator
Many traders misuse the Stochastic Indicator. One common mistake is trading every crossover without considering market conditions.
Another mistake is ignoring the trend. Taking buy signals in a strong downtrend or sell signals in a strong uptrend can lead to losses.
Traders also rely too heavily on the indicator without using price action or risk management.
Understanding these mistakes is essential for improving performance.
Best Timeframes for Stochastic Trading
The Stochastic Indicator can be used on different timeframes. Scalpers use lower timeframes like 5-minute or 15-minute charts.
Swing traders prefer 1-hour or 4-hour charts, while long-term traders use daily charts.
The key is to choose a timeframe that matches your trading style.
Advantages of Stochastic Indicator
The Stochastic Indicator is easy to use and provides clear signals. It helps traders identify entry and exit points with high accuracy.
It works well in both ranging and trending markets when used correctly.
Because of its simplicity and effectiveness, it is widely used by traders.
Limitations of Stochastic Indicator
Despite its advantages, the Stochastic Indicator has limitations. It can give false signals in strong trends.
It also reacts quickly, which can lead to premature entries.
Traders should use it along with other tools for better accuracy.
How Beginners Should Start Using Stochastic
Beginners should start by understanding the basic concept and practicing on demo accounts.
They should focus on simple strategies like crossover signals and avoid overcomplicating their analysis.
Proper risk management is essential for long-term success.
Trading Psychology and Discipline
Managing emotions effectively is a key factor in achieving consistent trading results. Emotions like fear and greed often push traders toward making incorrect decisions.
Traders should follow their strategy and avoid impulsive actions.
Discipline helps maintain consistency and improves performance over time.
Conclusion
The Stochastic Indicator is a powerful tool for identifying precise entry and exit points in forex trading. It helps traders understand market momentum and detect overbought and oversold conditions.
By using strategies like crossover signals, divergence, and trend confirmation, traders can improve their accuracy and consistency.
While the indicator is simple, mastering it requires practice, discipline, and proper risk management.
Forex trading is a long-term journey, and tools like the Stochastic Indicator can help traders navigate the market with confidence.
Join Our Community
Instagram: https://www.instagram.com/hadyjfx_official
YouTube: https://www.youtube.com/@hadyjmentor7793
Facebook: https://www.facebook.com/profile.php?id=61562232239915
Join Telegram: https://t.me/hadyjfx