Introduction
Many traders believe indicators are necessary to trade the forex market. They add moving averages, oscillators, and signals hoping these tools will tell them when to buy or sell. Over time, charts become crowded and confusing, yet results often do not improve.
Price action trading takes a different approach. Instead of relying on indicators, it focuses on price itself. Every move on a chart is created by buyers and sellers. By learning how to read this movement, traders can make decisions with clarity and confidence.
This article explains price action trading in a very simple way. You will learn how to understand candlestick behavior, identify important price levels, spot false breakouts, and trade using clean charts without indicators.
What Is Price Action Trading?
Price action trading means making trading decisions based only on how price moves. There are no indicators, signals, or automated tools involved. Traders observe candles, highs and lows, and how price reacts at certain areas.
Price action works because price reflects real market behavior. Every candle shows buying pressure, selling pressure, or balance between the two. By learning to read these movements, traders understand what the market is doing in real time.
Professional traders prefer price action because it is simple, flexible, and works across all markets and timeframes.
Understanding Candlestick Psychology
Candlesticks are not random shapes. Each candle represents a battle between buyers and sellers during a specific time period.
When a candle closes near its high, it shows buyers were stronger.
When it closes near its low, it shows sellers had control.
Small candles suggest hesitation or balance.
Long candles usually indicate strong emotion such as fear or confidence. Short candles often appear when traders are unsure.
By observing candle size, shape, and closing position, traders gain insight into market sentiment without using any indicator.
Support and Resistance Made Simple
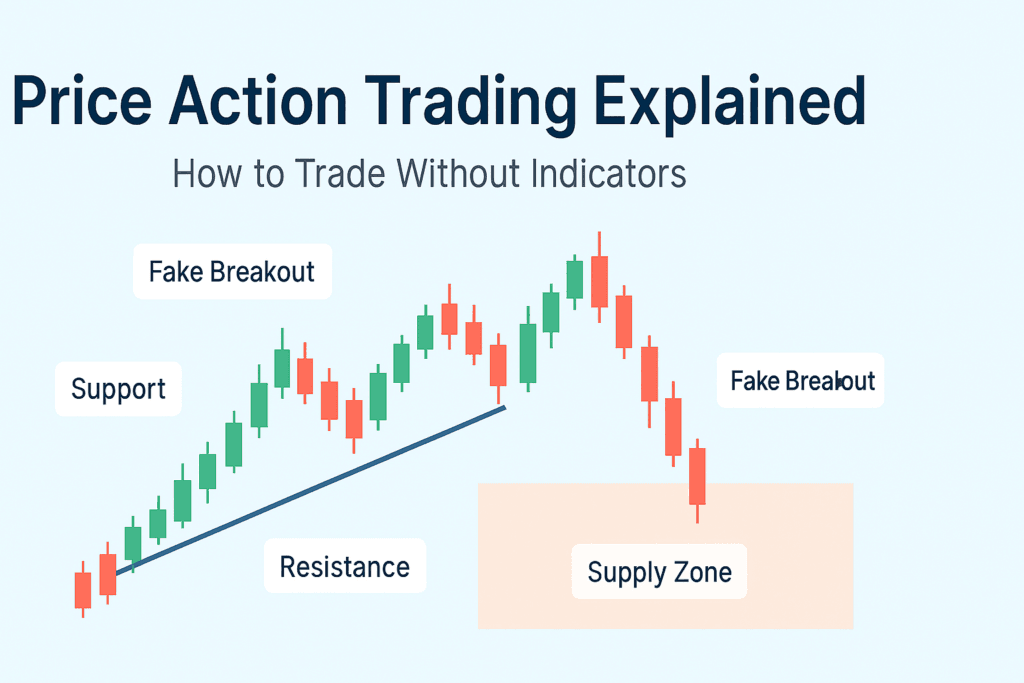
Support and resistance are areas where price has reacted strongly in the past.
Support is a price level where buying pressure has stopped price from falling further.
Resistance is a price level where selling pressure has stopped price from rising further.
These levels are important because traders remember them. When price returns to these areas, reactions often occur again.
Price action traders watch how price behaves at support and resistance instead of blindly entering trades. Strong reactions often lead to trading opportunities.
How to Draw Support and Resistance Correctly
Support and resistance are not exact lines. They are zones, not single prices.
To identify them:
- Look for areas where price changed direction multiple times
- Focus on obvious turning points
- Avoid drawing too many levels
Strong levels are easy to see. If you have to search hard, the level is probably weak.
Clean and simple levels work best.
Understanding Supply and Demand Zones
Supply and demand zones are areas where large buying or selling activity occurred in the past.
A demand zone forms where price moved up strongly after a pause.
A supply zone forms where price dropped sharply after slowing down.
These zones show where institutions were active. When price returns to these areas, reactions often happen again.
Price action traders wait for price to reach these zones and then observe candle behavior for confirmation.
Difference Between Support & Resistance and Supply & Demand
Support and resistance focus on where price reacted.
Supply and demand focus on where strong moves started.
Both concepts work well together. Many traders use support and resistance for structure and supply–demand zones for precision.
The key is to keep charts clean and avoid over-marking.
Fake Breakouts: Why Traders Get Trapped
A fake breakout happens when price moves beyond a key level but quickly reverses.
This often occurs because:
- Traders enter too early
- Stop losses are triggered
- Big players take advantage of weak entries
Fake breakouts are common near support, resistance, and range boundaries.
Price action traders wait for confirmation instead of reacting immediately to breakouts.
How to Spot Fake Breakouts Using Price Action
Signs of a fake breakout include:
- Long wicks beyond key levels
- Weak candle closes
- Immediate rejection after breakout
- Price returning back inside the range
When price fails to hold beyond a level, it often signals that the breakout was false.
Experienced traders wait for price to prove itself before entering trades.
Clean Chart Trading Approach
Clean chart trading means removing unnecessary tools and focusing only on price.
A clean chart usually includes:
- Candlesticks
- Support and resistance zones
- Supply and demand areas
No indicators are required.
This approach reduces confusion and helps traders make clear decisions based on what price is actually doing.
Why Trading Without Indicators Improves Clarity
Indicators are calculated from past price data. They often react late and sometimes give conflicting signals.
Price action shows what is happening right now.
By trading without indicators:
- Charts become easier to read
- Decisions become faster
- Emotional trading reduces
- Confidence improves
Many professional traders trade with little or no indicators for this reason.
Common Price Action Mistakes Beginners Make
Beginners often struggle because they:
- Trade every candle
- Ignore higher timeframes
- Enter trades without confirmation
- Over-mark charts with levels
- Chase breakouts
Price action trading requires patience. Waiting for price to reach important areas is more important than trading frequently.
How Beginners Should Practice Price Action
The best way to learn price action is observation.
Start by:
- Removing indicators
- Watching how price reacts at key levels
- Studying candle behavior
- Reviewing charts after market close
- Keeping notes of observations
Over time, patterns become familiar and confidence grows naturally.
Conclusion
Price action trading is about understanding price behavior without relying on indicators. By learning candlestick psychology, identifying important levels, spotting fake breakouts, and keeping charts clean, traders can make better decisions with less stress.
You do not need complicated tools to trade successfully. Price already shows everything you need. When you learn to read it properly, trading becomes simpler, calmer, and more consistent.
Price action is not a strategy. It is a way of seeing the market clearly.
Visit our Social media pages:
https://www.instagram.com/hadyjfx_official/
https://www.youtube.com/@hadyjmentor7793
https://www.facebook.com/profile.php?id=61562232239915
Join our free telegram channel:
https://t.me/hadyjfx