What is RSI Indicator in Forex Trading ?

The Relative Strength Index (RSI) is a momentum-based indicator used to evaluate the rate and magnitude of price fluctuations in the forex market. Developed by J. Welles Wilder, the RSI is one of the most widely used technical indicators in trading. It helps traders identify potential overbought or oversold conditions and possible reversal points in the market.
How RSI Works
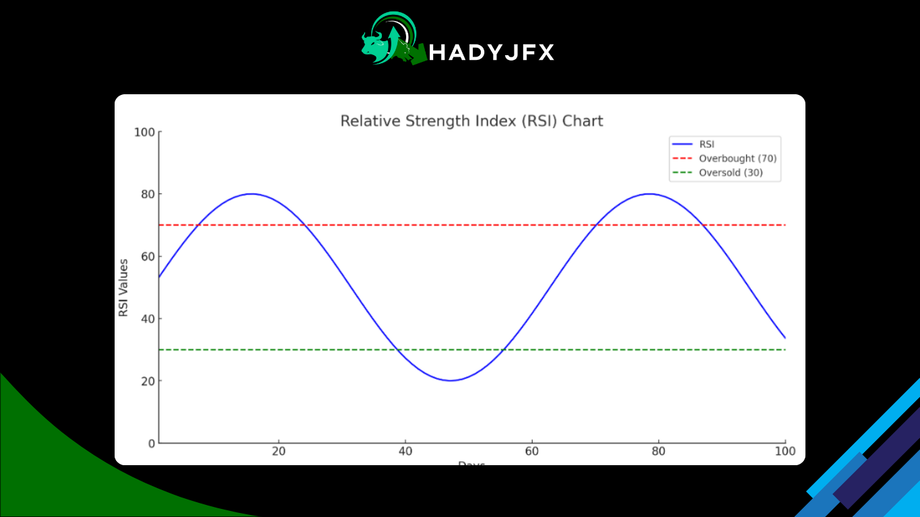
The range of RSI values is 0 to 100; values over 70 signify an overbought state, while values below 30 indicate an oversold one. The indicator is typically used over a 14-period timeframe, but traders can adjust it to suit their preferences. The RSI oscillates between these two extremes, providing insights into the strength of the current price trend.
Overbought Condition: When the RSI exceeds 70, it indicates that the market is likely overbought, meaning the asset’s price may be inflated and a correction or reversal could be imminent.
Oversold Condition: When the RSI falls below 30, it indicates that the market is potentially oversold, and a price bounce or reversal might be expected.

RSI Formula
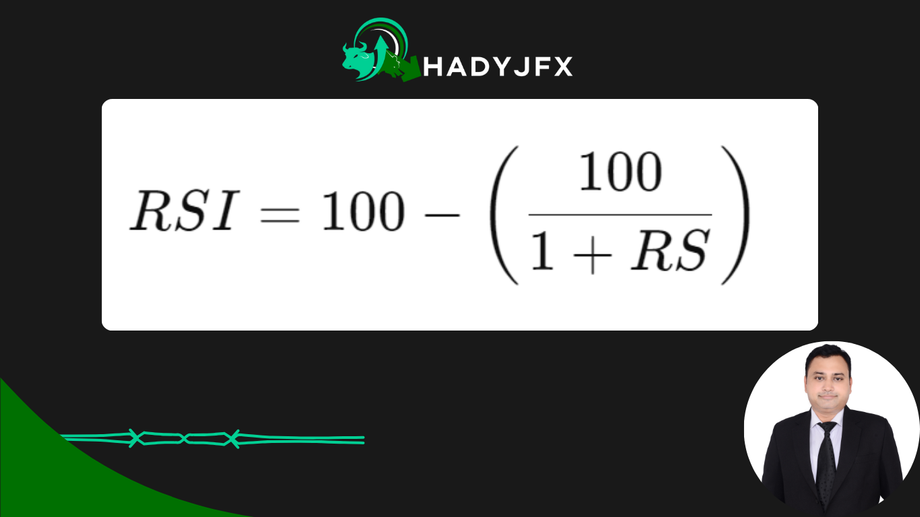
RSI is calculated using the following formula:

Where:
Calculating RS is as follows: RS = Average of Gains over ‘x’ Days / Average of Losses over ‘x’ Days.
The RSI provides a normalized value that can be interpreted as the strength of a trend relative to its recent price changes.
How to Use RSI in Forex Trading
Identifying Overbought and Oversold Levels: Traders use RSI to identify potential reversal points. An overbought RSI indicates the market is overheated and may reverse downward, while an oversold RSI suggests the market is undervalued and may reverse upward.
Divergence: RSI divergence happens when the price and RSI move in opposite directions. A possible upward reversal is indicated by bullish divergence, which occurs when prices make lower lows and the RSI makes higher lows. When prices reach higher highs but the RSI displays lower highs, indicating a possible downward trend, this is known as bearish divergence.
Centerline Crossovers: The RSI midpoint is 50, indicating trend strength. The RSI indicates an upward momentum that is strengthening when it crosses above 50, and a weakening trend or the beginning of a bearish trend when it crosses below 50.
Example: An RSI of 75 for EUR/USD indicates that the pair may be overbought and face a potential downward movement soon.
By incorporating the RSI into their strategy, traders can better time entry and exit points in the forex market and enhance risk management.
Visit our Social media pages:
https://www.instagram.com/hadyjfx_official
https://www.youtube.com/@hadyjmentor7793
https://www.facebook.com/profile.php?id=61562232239915


